Pfizer 2006 Annual Report Download - page 76
Download and view the complete annual report
Please find page 76 of the 2006 Pfizer annual report below. You can navigate through the pages in the report by either clicking on the pages listed below, or by using the keyword search tool below to find specific information within the annual report.-
 1
1 -
2
-
3
-
4
-
5
-
6
-
7
-
8
-
9
-
10
-
11
-
12
-
13
-
14
-
15
-
16
-
17
-
18
-
19
-
20
-
21
-
22
-
23
-
24
-
25
-
26
-
27
-
28
-
29
-
30
-
31
-
32
-
33
-
34
-
35
-
36
-
37
-
38
-
39
-
40
-
41
-
42
-
43
-
44
-
45
-
46
-
47
-
48
-
49
-
50
-
51
-
52
-
53
-
54
-
55
-
56
-
57
-
58
-
59
-
60
-
61
-
62
-
63
-
64
-
65
-
 66
66 -
 67
67 -
 68
68 -
 69
69 -
 70
70 -
 71
71 -
 72
72 -
 73
73 -
 74
74 -
 75
75 -
 76
76 -
 77
77 -
 78
78 -
 79
79 -
 80
80 -
 81
81 -
 82
82 -
 83
83 -
 84
84
 |
 |

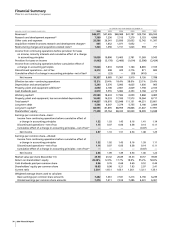
2006 Financial Report 75
Notes to Consolidated Financial Statements
Pfizer Inc and Subsidiary Companies
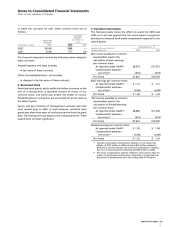
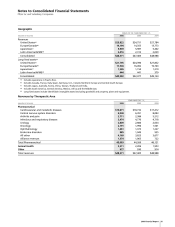
Geographic
FOR/AS OF THE YEAR ENDED DEC. 31,
(MILLIONS OF DOLLARS) 2006 2005 2004
Revenues
United States
(a)
$25,822 $24,751 $27,784
Europe/Canada
(b)
14,194 14,355 13,773
Japan/Asia
(c)
5,939 5,987 5,402
Latin America/AFME
(d)
2,416 2,312 2,029
Consolidated $48,371 $47,405 $48,988
Long-lived assets
(e)
United States
(a)
$21,795 $24,390 $27,832
Europe/Canada
(b)
17,538 16,492 19,703
Japan/Asia
(c)
1,205 1,154 1,210
Latin America/AFME
(d)
444 441 379
Consolidated $40,982 $42,477 $49,124
(a)
Includes operations in Puerto Rico.
(b)
Includes Canada, France, Italy, Spain, Germany, U.K., Ireland, Northern Europe and Central-South Europe.
(c)
Includes Japan, Australia, Korea, China, Taiwan, Thailand and India.
(d)
Includes South America, Central America, Mexico, Africa and the Middle East.
(e)
Long-lived assets include identifiable intangible assets (excluding goodwill) and property, plant and equipment.
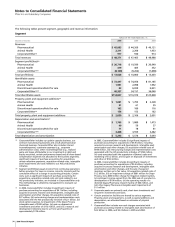
Revenues by Therapeutic Area
YEAR ENDED DEC. 31,
(MILLIONS OF DOLLARS) 2006 2005 2004
Pharmaceutical
Cardiovascular and metabolic diseases $19,871 $18,732 $17,412
Central nervous system disorders 6,038 6,391 8,093
Arthritis and pain 2,711 2,386 5,212
Infectious and respiratory diseases 3,474 4,770 4,718
Urology 2,809 2,684 2,634
Oncology 2,191 1,996 1,501
Ophthalmology 1,461 1,373 1,227
Endocrine disorders 985 1,049 925
All other 4,169 3,823 3,677
Alliance revenues 1,374 1,065 722
Total Pharmaceutical 45,083 44,269 46,121
Animal Health 2,311 2,206 1,953
Other 977 930 914
Total revenues $48,371 $47,405 $48,988