Pfizer 2006 Annual Report Download - page 66
Download and view the complete annual report
Please find page 66 of the 2006 Pfizer annual report below. You can navigate through the pages in the report by either clicking on the pages listed below, or by using the keyword search tool below to find specific information within the annual report.-
 1
1 -
2
-
3
-
4
-
5
-
6
-
7
-
8
-
9
-
10
-
11
-
12
-
13
-
14
-
15
-
16
-
17
-
18
-
19
-
20
-
21
-
22
-
23
-
24
-
25
-
26
-
27
-
28
-
29
-
30
-
31
-
32
-
33
-
34
-
35
-
36
-
37
-
38
-
39
-
40
-
41
-
42
-
43
-
44
-
45
-
46
-
47
-
48
-
49
-
50
-
51
-
52
-
53
-
54
-
55
-
 56
56 -
 57
57 -
 58
58 -
 59
59 -
 60
60 -
 61
61 -
 62
62 -
 63
63 -
 64
64 -
 65
65 -
 66
66 -
 67
67 -
 68
68 -
 69
69 -
 70
70 -
 71
71 -
 72
72 -
 73
73 -
 74
74 -
 75
75 -
 76
76 -
77
-
78
-
79
-
80
-
81
-
82
-
83
-
84
 |
 |

2006 Financial Report 65
Notes to Consolidated Financial Statements
Pfizer Inc and Subsidiary Companies
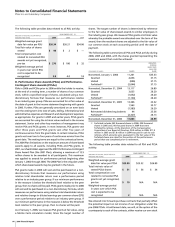
or settle the contracts for cash. Other contract terms are as
follows:
MAXIMUM
MATURITY
PER SHARE
AS OF DEC. 31,
PURCHASE
(YEARS)
(THOUSANDS OF SHARES) PRICE 2006 2005
3,051 $33.85 0.4 —
3,051 33.84 — 0.4
The financial statements include the following items related to
these contracts:
Prepaid expenses and taxes includes:
•
fair value of these contracts.
Other (income)/deductions—net includes:
•
changes in the fair value of these contracts.
E. Restricted Stock
Restricted stock grants, which entitle the holder to receive, at the
end of a vesting term, a specified number of shares of our
common stock, and which also entitle the holder to receive
dividends paid on such grants, are accounted for at fair value at
the date of grant.
Senior and key members of management received restricted
stock awards prior to 2005. In most instances, restricted stock
grants vest after three years of continuous service from the grant
date. The vesting terms are equal to the contractual terms. These
awards have not been significant.
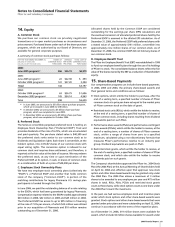
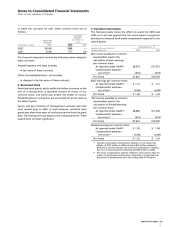
F. Transition Information
The following table shows the effect on results for 2005 and
2004 as if we had applied the fair-value-based recognition
provisions to measure stock-based compensation expense for the
option grants:
YEAR ENDED DEC. 31,
________________________________________
(MILLIONS OF DOLLARS, EXCEPT PER
COMMON SHARE DATA)
2005 2004
Net income available to common
shareholders used in the
calculation of basic earnings
per common share:
As reported under GAAP
(a)
$8,079 $11,357
Compensation expense—
net of tax
(b)
(457) (574)
Pro forma $7,622 $10,783
Basic earnings per common share:
As reported under GAAP
(a)
$ 1.10 $ 1.51
Compensation expense—
net of tax
(b)
(0.06) (0.08)
Pro forma $ 1.04 $ 1.43
Net income available to common
shareholders used in the
calculation of diluted earnings
per common share:
As reported under GAAP
(a)
$8,080 $11,356
Compensation expense—
net of tax
(b)
(457) (574)
Pro forma $7,623 $10,782
Diluted earnings per common share:
As reported under GAAP
(a)
$ 1.09 $ 1.49
Compensation expense—
net of tax
(b)
(0.06) (0.08)
Pro forma $ 1.03 $ 1.41
(a)
Includes stock-based compensation expense, net of related tax
effects, of $107 million in 2005 (of which $70 million related to
RSUs and a nominal amount was a result of acceleration of vesting
due to our AtS productivity initiative) and $38 million in 2004.
(b)
Pro forma compensation expense related to stock options that are
subject to accelerated vesting upon retirement is recognized over
the period of employment up to the vesting date of the grant.