Pfizer 2006 Annual Report Download - page 41
Download and view the complete annual report
Please find page 41 of the 2006 Pfizer annual report below. You can navigate through the pages in the report by either clicking on the pages listed below, or by using the keyword search tool below to find specific information within the annual report.-
 1
1 -
2
-
3
-
4
-
5
-
6
-
7
-
8
-
9
-
10
-
11
-
12
-
13
-
14
-
15
-
16
-
17
-
18
-
19
-
20
-
21
-
22
-
23
-
24
-
25
-
26
-
27
-
28
-
29
-
30
-
 31
31 -
 32
32 -
 33
33 -
 34
34 -
 35
35 -
 36
36 -
 37
37 -
 38
38 -
 39
39 -
 40
40 -
 41
41 -
 42
42 -
 43
43 -
 44
44 -
 45
45 -
 46
46 -
 47
47 -
 48
48 -
 49
49 -
 50
50 -
 51
51 -
52
-
53
-
54
-
55
-
56
-
57
-
58
-
59
-
60
-
61
-
62
-
63
-
64
-
65
-
66
-
67
-
68
-
69
-
70
-
71
-
72
-
73
-
74
-
75
-
76
-
77
-
78
-
79
-
80
-
81
-
82
-
83
-
84
 |
 |

2006 Financial Report 39
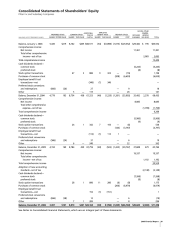
Consolidated Statements of Shareholders’ Equity
Pfizer Inc and Subsidiary Companies
EMPLOYEE
ACCUM. OTHER
PREFERRED STOCK COMMON STOCK
ADDITIONAL
BENEFIT TRUST TREASURY STOCK
COMPRE-
____________________________ __________________________ PAID-IN ___________________________ ___________________________ RETAINED HENSIVE
(MILLIONS, EXCEPT PREFERRED SHARES)
SHARES STATED VALUE SHARES PAR VALUE CAPITAL SHARES FAIR VALUE SHARES COST EARNINGS INC./(EXP.) TOTAL
Balance, January 1, 2004 5,445 $219 8,702 $435 $66,571 (54) $(1,898) (1,073) $(29,352) $29,382 $ 195 $65,552
Comprehensive income:
Net income 11,361 11,361
Total other comprehensive
income—net of tax 2,083 2,083
Total comprehensive income 13,444
Cash dividends declared—
common stock (5,243) (5,243)
preferred stock (8) (8)
Stock option transactions 47 3 886 9 323 — (16) 1,196
Purchases of common stock (208) (6,659) (6,659)
Employee benefit trust
transactions—net (346) (1) 346 —
Preferred stock conversions
and redemptions (666) (26) 27 — 9 10
Other 5 — 115 — 26 141
Balance, December 31, 2004 4,779 193 8,754 438 67,253 (46) (1,229) (1,281) (35,992) 35,492 2,278 68,433
Comprehensive income:
Net income 8,085 8,085
Total other comprehensive
expense—net of tax (1,799) (1,799)
Total comprehensive income 6,286
Cash dividends declared—
common stock (5,960) (5,960)
preferred stock (9) (9)
Stock option transactions 24 1 342 7 193 — (6) 530
Purchases of common stock (143) (3,797) (3,797)
Employee benefit trust
transactions—net (113) (1) 113 1 — —
Preferred stock conversions
and redemptions (586) (24) 37 — 6 19
Other 6 — 240 — 22 262
Balance, December 31, 2005 4,193 169 8,784 439 67,759 (40) (923) (1,423) (39,767) 37,608 479 65,764
Comprehensive income:
Net income 19,337 19,337
Total other comprehensive
income—net of tax 1,192 1,192
Total comprehensive income 20,529
Adoption of new accounting
standard—net of tax (2,140) (2,140)
Cash dividends declared—
common stock (7,268) (7,268)
preferred stock (8) (8)
Stock option transactions 28 1 896 11 286 (6) (8) 1,175
Purchases of common stock (266) (6,979) (6,979)
Employee benefit trust
transactions—net 152 (1) (151) 1
Preferred stock conversions
and redemptions (696) (28) 12 — 6 (10)
Other 7 1 285 — 8 294
Balance, December 31, 2006 3,497 $141 8,819 $441 $69,104 (30) $ (788) (1,695) $(46,740) $49,669 $ (469) $71,358
See Notes to Consolidated Financial Statements, which are an integral part of these statements.