Pfizer 2006 Annual Report Download - page 17
Download and view the complete annual report
Please find page 17 of the 2006 Pfizer annual report below. You can navigate through the pages in the report by either clicking on the pages listed below, or by using the keyword search tool below to find specific information within the annual report.-
 1
1 -
2
-
3
-
4
-
5
-
6
-
 7
7 -
 8
8 -
 9
9 -
 10
10 -
 11
11 -
 12
12 -
 13
13 -
 14
14 -
 15
15 -
 16
16 -
 17
17 -
 18
18 -
 19
19 -
 20
20 -
 21
21 -
 22
22 -
 23
23 -
 24
24 -
 25
25 -
 26
26 -
 27
27 -
28
-
29
-
30
-
31
-
32
-
33
-
34
-
35
-
36
-
37
-
38
-
39
-
40
-
41
-
42
-
43
-
44
-
45
-
46
-
47
-
48
-
49
-
50
-
51
-
52
-
53
-
54
-
55
-
56
-
57
-
58
-
59
-
60
-
61
-
62
-
63
-
64
-
65
-
66
-
67
-
68
-
69
-
70
-
71
-
72
-
73
-
74
-
75
-
76
-
77
-
78
-
79
-
80
-
81
-
82
-
83
-
84
 |
 |

2006 Financial Report 15
Financial Review
Pfizer Inc and Subsidiary Companies
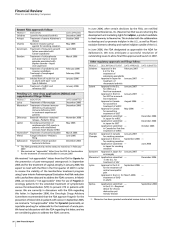
Change in Revenues by Segment and Geographic Area
Worldwide revenues by segment and geographic area follow:
YEAR ENDED DEC. 31, % CHANGE
____________________________________________________________________________________________ _______________________________________________
WORLDWIDE U.S. INTERNATIONAL WORLDWIDE U.S. INTERNATIONAL
___________________________ ___________________________ ___________________________ ______________ ______________ _______________
(MILLIONS OF DOLLARS) 2006 2005 2004 2006 2005 2004 2006 2005 2004 06/05 05/04 06/05 05/04 06/05 05/04
Revenues:
Pharmaceutical $45,083 $44,269 $46,121 $24,503 $23,465 $26,606 $20,580 $20,804 $19,515 2 (4) 4 (12) (1) 7
Animal Health 2,311 2,206 1,953 1,032 993 878 1,279 1,213 1,075 5 13 4 13 5 13
Corporate/Other 977 930 914 287 287 298 690 643 616 5 2 — (4) 7 4
Total Revenues $48,371 $47,405 $48,988 $25,822 $24,745 $27,782 $22,549 $22,660 $21,206 2 (3) 4 (11) — 7
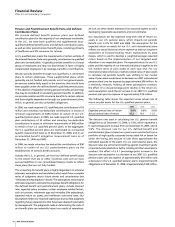
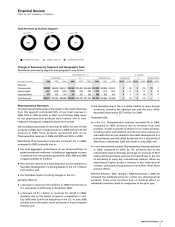
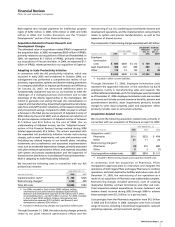
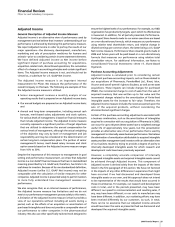
Total Revenues by Business Segment
93.2% 93.4% 94.1%
4.8%
2.0%
4.6%
2.0%
4.0%
1.9%
2006 2005 2004
PHARMACEUTICAL ANIMAL HEALTH CORPORATE/OTHER
Pharmaceutical Revenues
Our pharmaceutical business is the largest in the world. Revenues
from this segment contributed 93% of our total revenues in
2006, 93% in 2005 and 94% in 2004. As of October 2006, seven
of our pharmaceutical products were number one in their
respective therapeutic categories based on revenues.
We recorded product sales of more than $1 billion for each of nine
products in 2006, each of eight products in 2005 and each of ten
products in 2004. These products represented 64% of our
Pharmaceutical revenues in 2006 and 2005 and 69% in 2004.
Worldwide Pharmaceutical revenues increased 2% in 2006,
compared to 2005, primarily due to:
•
the solid aggregate performance of our broad portfolio of
patent-protected medicines, including an aggregate increase
in revenues from new products launched in 2004, 2005 and 2006
of approximately $1.5 billion;
•
the one-time reversal of a sales deduction accrual related to a
favorable development in a pricing dispute in the U.S. of about
$170 million; and
•
the favorable impact of pricing changes in the U.S.,
partially offset by:
•
a decrease in revenues of $1.4 billion in 2006 from the loss of
U.S. exclusivity on Zithromax in November 2005;
•
a decrease by $1.1 billion in revenues for Zoloft in 2006,
primarily due to the launch of generic competition in mid-
July 2006 after Zoloft lost exclusivity in the U.S. in June 2006
and also due to the earlier loss of exclusivity in many European
markets; and
•
the strengthening of the U.S. dollar relative to many foreign
currencies, primarily the Japanese yen and the euro, which
decreased revenues by $277 million for 2006.
Geographically:
•
in the U.S., Pharmaceutical revenues increased 4% in 2006,
compared to 2005, primarily due to revenues from new
products, as well as growth in several of our major products,
including Lipitor and Celebrex, and the one-time reversal of a
sales deduction accrual related to favorable development in a
pricing dispute, partially offset by the loss of U.S. exclusivity of
Zithromax in November 2005 and Zoloft in June 2006; and
•
in our international markets, Pharmaceutical revenues declined
in 2006, compared to 2005, by 1%, primarily due to the
unfavorable impact of foreign exchange on revenues of $277
million (0.6%) and lower revenues from Zoloft due to the loss
of exclusivity in many key international markets. While we
experienced higher product volumes in our international
markets, continued pricing pressures more than offset those
positive effects.
Effective January 1, 2007, January 1, 2006 and January 1, 2005, we
increased the published prices for certain U.S. pharmaceutical
products. These price increases had no material effect on
wholesaler inventory levels in comparison to the prior year.