Pfizer 2006 Annual Report Download - page 31
Download and view the complete annual report
Please find page 31 of the 2006 Pfizer annual report below. You can navigate through the pages in the report by either clicking on the pages listed below, or by using the keyword search tool below to find specific information within the annual report.-
 1
1 -
2
-
3
-
4
-
5
-
6
-
7
-
8
-
9
-
10
-
11
-
12
-
13
-
14
-
15
-
16
-
17
-
18
-
19
-
20
-
 21
21 -
 22
22 -
 23
23 -
 24
24 -
 25
25 -
 26
26 -
 27
27 -
 28
28 -
 29
29 -
 30
30 -
 31
31 -
 32
32 -
 33
33 -
 34
34 -
 35
35 -
 36
36 -
 37
37 -
 38
38 -
 39
39 -
 40
40 -
 41
41 -
42
-
43
-
44
-
45
-
46
-
47
-
48
-
49
-
50
-
51
-
52
-
53
-
54
-
55
-
56
-
57
-
58
-
59
-
60
-
61
-
62
-
63
-
64
-
65
-
66
-
67
-
68
-
69
-
70
-
71
-
72
-
73
-
74
-
75
-
76
-
77
-
78
-
79
-
80
-
81
-
82
-
83
-
84
 |
 |

December 31, 2006, we had access to $3.6 billion of lines of
credit, of which $1.2 billion expire within one year. Of these lines
of credit, $3.4 billion are unused, of which our lenders have
committed to loan us $2.2 billion at our request. $2 billion of the
unused lines of credit, which expire in 2011, may be used to
support our commercial paper borrowings.
As of February 27, 2007, we had the ability to borrow
approximately $1 billion by issuing debt securities under our
existing debt shelf registration statement filed with the SEC in
November 2002.
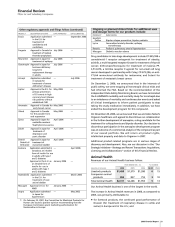
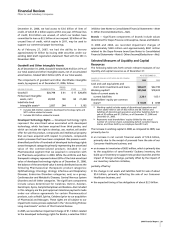
Goodwill and Other Intangible Assets
As of December 31, 2006, Goodwill totaled $20.9 billion (17% of
our total assets) and other intangible assets, net of accumulated
amortization, totaled $24.3 billion (20% of our total assets).
The components of goodwill and other identifiable intangible
assets, by segment, as of December 31, 2006, follow:
ANIMAL
(MILLIONS OF DOLLARS) PHARMACEUTICAL HEALTH OTHER TOTAL
Goodwill $20,798 $ 61 $ 17 $20,876
Finite-lived intangible
assets, net
(a)
20,995 169 84 21,248
Indefinite-lived
intangible assets
(b)
2,857 244 1 3,102
(a)
Includes $20.3 billion related to developed technology rights and
$471 million related to brands.
(b)
Includes $3.0 billion related to brands.
Developed Technology Rights — Developed technology rights
represent the amortized value associated with developed
technology, which has been acquired from third parties, and
which can include the right to develop, use, market, sell and/or
offer for sale the product, compounds and intellectual property
that we have acquired with respect to products, compounds
and/or processes that have been completed. We possess a well-
diversified portfolio of hundreds of developed technology rights
across therapeutic categories primarily representing the amortized
value of the commercialized products included in our
Pharmaceutical segment that we acquired in connection with
our Pharmacia acquisition in 2003. While the Arthritis and Pain
therapeutic category represents about 28% of the total amortized
value of developed technology rights as of December 31, 2006,
the balance of the amortized value is evenly distributed across the
following Pharmaceutical therapeutic product categories:
Ophthalmology; Oncology; Urology; Infectious and Respiratory
Diseases; Endocrine Disorders categories; and, as a group,
Cardiovascular and Metabolic Diseases; Central Nervous System
Disorders and All Other categories. The significant components
include values determined for Celebrex, Detrol, Xalatan,
Genotropin, Zyvox, Campto/Camptosar and Exubera. Also included
in this category are the post-approval milestone payments made
under our alliance agreements for certain Pharmaceutical
products, such as Rebif, Spiriva, Celebrex (prior to our acquisition
of Pharmacia) and Macugen. These rights are all subject to our
impairment review process explained in the “Accounting Policies:
Long-Lived Assets” section of this Financial Review.
In 2005, we recorded an impairment charge of $1.1 billion related
to the developed technology rights for Bextra, a selective COX-2
inhibitor (see Notes to Consolidated Financial Statements—Note
6. Other (Income)/Deductions—Net).
Brands — Significant components of brands include values
determined for Depo-Provera contraceptive, Xanax and Medrol.
In 2006 and 2004, we recorded impairment charges of
approximately $320 million and approximately $691 million
related to the Depo-Provera brand (see Notes to Consolidated
Financial Statements—Note 6. Other (Income)/Deductions—Net).
Selected Measures of Liquidity and Capital
Resources
The following table sets forth certain relevant measures of our
liquidity and capital resources as of December 31:
AS OF DECEMBER 31,
__________________________________
(MILLIONS OF DOLLARS, EXCEPT RATIOS AND PER COMMON
SHARE DATA) 2006 2005
Cash and cash equivalents and
short-term investments and loans $28,227 $22,736
Working capital
(a)
$25,560 $18,433
Ratio of current assets to
current liabilities 2.20:1 1.65:1
Shareholders’ equity per common
share
(b)
$ 10.05 $ 8.98
(a)
Working capital includes assets of discontinued operations and
other assets held for sale of $62 million and $6.7 billion and
liabilities of discontinued operations and other liabilities held for
sale of $2 million and $1.2 billion, as of December 31, 2006 and
December 31, 2005.
(b)
Represents total shareholders’ equity divided by the actual
number of common shares outstanding (which excludes treasury
shares, and those held by our employee benefit trust).
The increase in working capital in 2006, as compared to 2005, was
primarily due to:
•
an increase in net current financial assets of $14.6 billion,
primarily due to the receipt of proceeds from the sale of our
Consumer Healthcare business; and
•
an increase in inventories of $633 million, which is primarily due
to the acquisition of sanofi-aventis’ Exubera inventory, the
build-up of inventory to support new product launches and the
impact of foreign exchange, partially offset by the impact of
our inventory reduction initiative,
partially offset by:
•
the change in net assets and liabilities held for sale of about
$5.4 billion, primarily reflecting the sale of our Consumer
Healthcare business; and
•
the expected timing of tax obligations of about $2.5 billion.
2006 Financial Report 29
Financial Review
Pfizer Inc and Subsidiary Companies