Pfizer 2006 Annual Report Download - page 62
Download and view the complete annual report
Please find page 62 of the 2006 Pfizer annual report below. You can navigate through the pages in the report by either clicking on the pages listed below, or by using the keyword search tool below to find specific information within the annual report.-
 1
1 -
2
-
3
-
4
-
5
-
6
-
7
-
8
-
9
-
10
-
11
-
12
-
13
-
14
-
15
-
16
-
17
-
18
-
19
-
20
-
21
-
22
-
23
-
24
-
25
-
26
-
27
-
28
-
29
-
30
-
31
-
32
-
33
-
34
-
35
-
36
-
37
-
38
-
39
-
40
-
41
-
42
-
43
-
44
-
45
-
46
-
47
-
48
-
49
-
50
-
51
-
 52
52 -
 53
53 -
 54
54 -
 55
55 -
 56
56 -
 57
57 -
 58
58 -
 59
59 -
 60
60 -
 61
61 -
 62
62 -
 63
63 -
 64
64 -
 65
65 -
 66
66 -
 67
67 -
 68
68 -
 69
69 -
 70
70 -
 71
71 -
 72
72 -
73
-
74
-
75
-
76
-
77
-
78
-
79
-
80
-
81
-
82
-
83
-
84
 |
 |

60 2006 Financial Report
Notes to Consolidated Financial Statements
Pfizer Inc and Subsidiary Companies
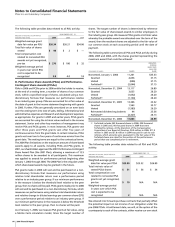
In the aggregate, our U.S. qualified pension plans had assets
greater than their ABO and their PBO as of December 31, 2006.
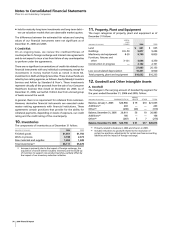
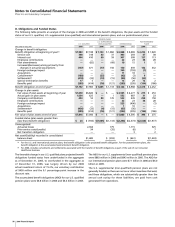
E. Plan Assets
The following table presents the weighted-average long-term
target asset allocations and the percentages of the fair value of plan
assets for our U.S. qualified and international pension plans and
postretirement plans by investment category as of December 31:
TARGET PERCENTAGE OF
ALLOCATION PLAN ASSETS
(PERCENTAGES) 2006 2006 2005
U.S. qualified pension plans:
Global equity securities 65.0 68.6 66.8
Debt securities 25.0 22.8 23.9
Alternative investments
(a)
10.0 8.4 8.9
Cash — 0.2 0.4
Total 100.0 100.0 100.0
International pension plans:
Global equity securities 62.5 62.2 63.9
Debt securities 27.5 23.7 26.0
Alternative investments
(b)
9.7 10.3 8.8
Cash 0.3 3.8 1.3
Total 100.0 100.0 100.0
U.S. postretirement plans
(c)
:
Global equity securities 75.0 74.8 75.4
Debt securities 25.0 23.1 24.6
Alternative investments
(a)
— 2.1 —
Total 100.0 100.0 100.0
(a)
Private equity, venture capital, private debt and real estate.
(b)
Real estate, insurance contracts and other investments.
(c)
Reflects postretirement plan assets, which support a portion of
our U.S. retiree medical plans.
All long-term asset allocation targets reflect our asset class return
expectations and tolerance for investment risk within the context
of the respective plans’ long-term benefit obligations. The long-
term asset allocation is supported by an analysis that incorporates
historical and expected returns by asset class, as well as volatilities
and correlations across asset classes and our liability profile. This
analysis, referred to as an asset-liability analysis, also provides an
estimate of expected returns on plan assets, as well as a forecast
of potential future asset and liability balances. Due to market
conditions and other factors, actual asset allocations may vary from
the target allocation outlined above. For the U.S. qualified pension
plans, the year-end 2006 alternative investments allocation of
8.4% was below the target allocation, primarily due to the timing
of our commitments. The assets are periodically rebalanced back
to the target allocation.
The U.S. qualified pension plans held approximately 10.2 million
shares (fair value of approximately $263 million, representing 3.3%
of U.S. plan assets) as of December 31, 2006, and approximately
10.3 million shares (fair value of approximately $240 million,
representing 3.5% of U.S. plan assets) as of December 31, 2005,
of our common stock. The plans received approximately $10
million in dividends on these shares in 2006 and approximately
$8 million in dividends on these shares in 2005.
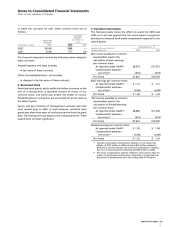
F. Cash Flows
It is our practice to fund amounts for our qualified pension plans
that are at least sufficient to meet the minimum requirements set
forth in applicable employee benefit laws and local tax laws.
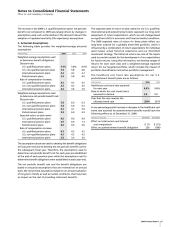
The following table presents expected cash flow information:
PENSION PLANS
FOR THE YEAR
ENDED U.S. POST-
DECEMBER 31, U.S. SUPPLEMENTAL RETIREMENT
(MILLIONS OF DOLLARS) QUALIFIED (NON-QUALIFIED) INTERNATIONAL PLANS
Employer
contributions:
2007 (estimated) $ 3 $ 99 $ 347 $172
Expected benefit
payments:
2007 $ 420 $ 99 $ 286 $172
2008 407 82 301 176
2009 431 81 314 179
2010 454 79 324 182
2011 476 79 337 184
2012–2016 2,845 390 1,873 906
The table reflects the total U.S. plan benefits projected to be paid
from the plans or from our general assets under the current
actuarial assumptions used for the calculation of the benefit
obligation and, therefore, actual benefit payments may differ from
projected benefit payments. Under the provisions of the Medicare
Prescription Drug Improvement and Modernization Act of 2003,
the expected benefit payments for our U.S. postretirement plans
were reduced by $161 million through 2016.
G. Defined Contribution Plans
We have savings and investment plans in several countries,
including the U.S., Puerto Rico, Japan and Sweden. For the U.S.
and Puerto Rico plans, employees may contribute a portion of their
salaries and bonuses to the plans, and we match, largely in
company stock, a portion of the employee contributions. In the
U.S. and Puerto Rico, effective March 1, 2007, employees are
permitted to diversify all or any portion of their company stock
match contribution. The contribution match for certain legacy
Pfizer U.S. participants is held in an employee stock ownership
plan. We recorded charges related to our plans of $222 million in
2006, $234 million in 2005 and $313 million in 2004.