Nordstrom 2000 Annual Report Download - page 40
Download and view the complete annual report
Please find page 40 of the 2000 Nordstrom annual report below. You can navigate through the pages in the report by either clicking on the pages listed below, or by using the keyword search tool below to find specific information within the annual report.-
 1
1 -
2
-
3
-
4
-
5
-
6
-
7
-
8
-
9
-
10
-
11
-
12
-
13
-
14
-
15
-
16
-
17
-
18
-
19
-
20
-
21
-
22
-
23
-
24
-
25
-
26
-
27
-
28
-
29
-
 30
30 -
 31
31 -
 32
32 -
 33
33 -
 34
34 -
 35
35 -
 36
36 -
 37
37 -
 38
38 -
 39
39 -
 40
40 -
 41
41 -
 42
42 -
 43
43 -
 44
44 -
 45
45 -
 46
46 -
 47
47 -
 48
48
 |
 |

Cyan Mag Yelo Blk
20100444 Nordstrom
2001 Annual Report • 44pgs. + 4 covers pg. 38
8.375 x 10.875 • PDF • 150 lpi
PMS
5773
PMS
5503
38
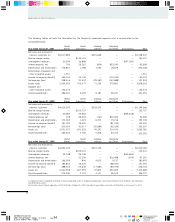
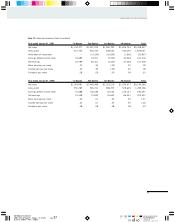
NORDSTROM, INC. AND SUBSIDIARIES
Ten-Year Statistical Summary
Dollars in thousands except square footage and per share amounts
Year ended January 31, 2001 2000 1999
Financial Position
Customer accounts receivable, net $ 699,687 $ 596,020 $ 567,661
Merchandise inventories 945,687 797,845 750,269
Current assets 1,812,982 1,564,648 1,668,689
Current liabilities 950,568 866,509 794,490
Working capital 862,414 698,139 874,199
Working capital ratio 1.91 1.81 2.10
Land, buildings and equipment, net 1,599,938 1,429,492 1,378,006
Long-term debt, including current portion 1,112,296 804,982 868,234
Debt/capital ratio .4929 .4249 .4214
Shareholders’ equity 1,229,568 1,185,614 1,300,545
Shares outstanding 133,797,757 132,279,988 142,114,167
Book value per share 9.19 8.96 9.15
Total assets 3,608,503 3,062,081 3,103,689
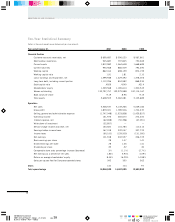
Operations
Net sales 5,528,537 5,149,266 5,049,182
Gross profit 1,879,021 1,789,506 1,704,237
Selling, general and administrative expense (1,747,048) (1,523,836) (1,429,837)
Operating income 131,973 265,670 274,400
Interest expense, net (62,698) (50,396) (47,091)
Write-down of investment (32,857) — —
Service charge income and other, net 130,600 116,783 110,414
Earnings before income taxes 167,018 332,057 337,723
Income taxes (65,100) (129,500) (131,000)
Net earnings 101,918 202,557 206,723
Basic earnings per share .78 1.47 1.41
Diluted earnings per share .78 1.46 1.41
Dividends per share .35 .32 .30
Comparable store sales percentage increase (decrease) .3% (1.1%) (2.7%)
Net earnings as a percent of net sales 1.84% 3.93% 4.09%
Return on average shareholders’ equity 8.44% 16.29% 14.98%
Sales per square foot for Company-operated stores 342 350 362
Stores 140 104 97
Total square footage 16,056,000 14,487,0 00 13,593,0 00