Nordstrom 2000 Annual Report Download - page 17
Download and view the complete annual report
Please find page 17 of the 2000 Nordstrom annual report below. You can navigate through the pages in the report by either clicking on the pages listed below, or by using the keyword search tool below to find specific information within the annual report.-
 1
1 -
2
-
3
-
4
-
5
-
6
-
 7
7 -
 8
8 -
 9
9 -
 10
10 -
 11
11 -
 12
12 -
 13
13 -
 14
14 -
 15
15 -
 16
16 -
 17
17 -
 18
18 -
 19
19 -
 20
20 -
 21
21 -
 22
22 -
 23
23 -
 24
24 -
 25
25 -
 26
26 -
 27
27 -
28
-
29
-
30
-
31
-
32
-
33
-
34
-
35
-
36
-
37
-
38
-
39
-
40
-
41
-
42
-
43
-
44
-
45
-
46
-
47
-
48
 |
 |
Cyan Mag Yelo Blk
20100444 Nordstrom
2001 Annual Report • 44pgs. + 4 covers pg. 15
8.375 x 10.875 • PDF • 150 lpi
PMS
5773
PMS
5503
15
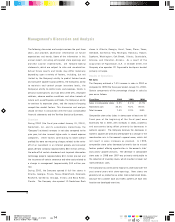
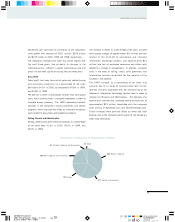
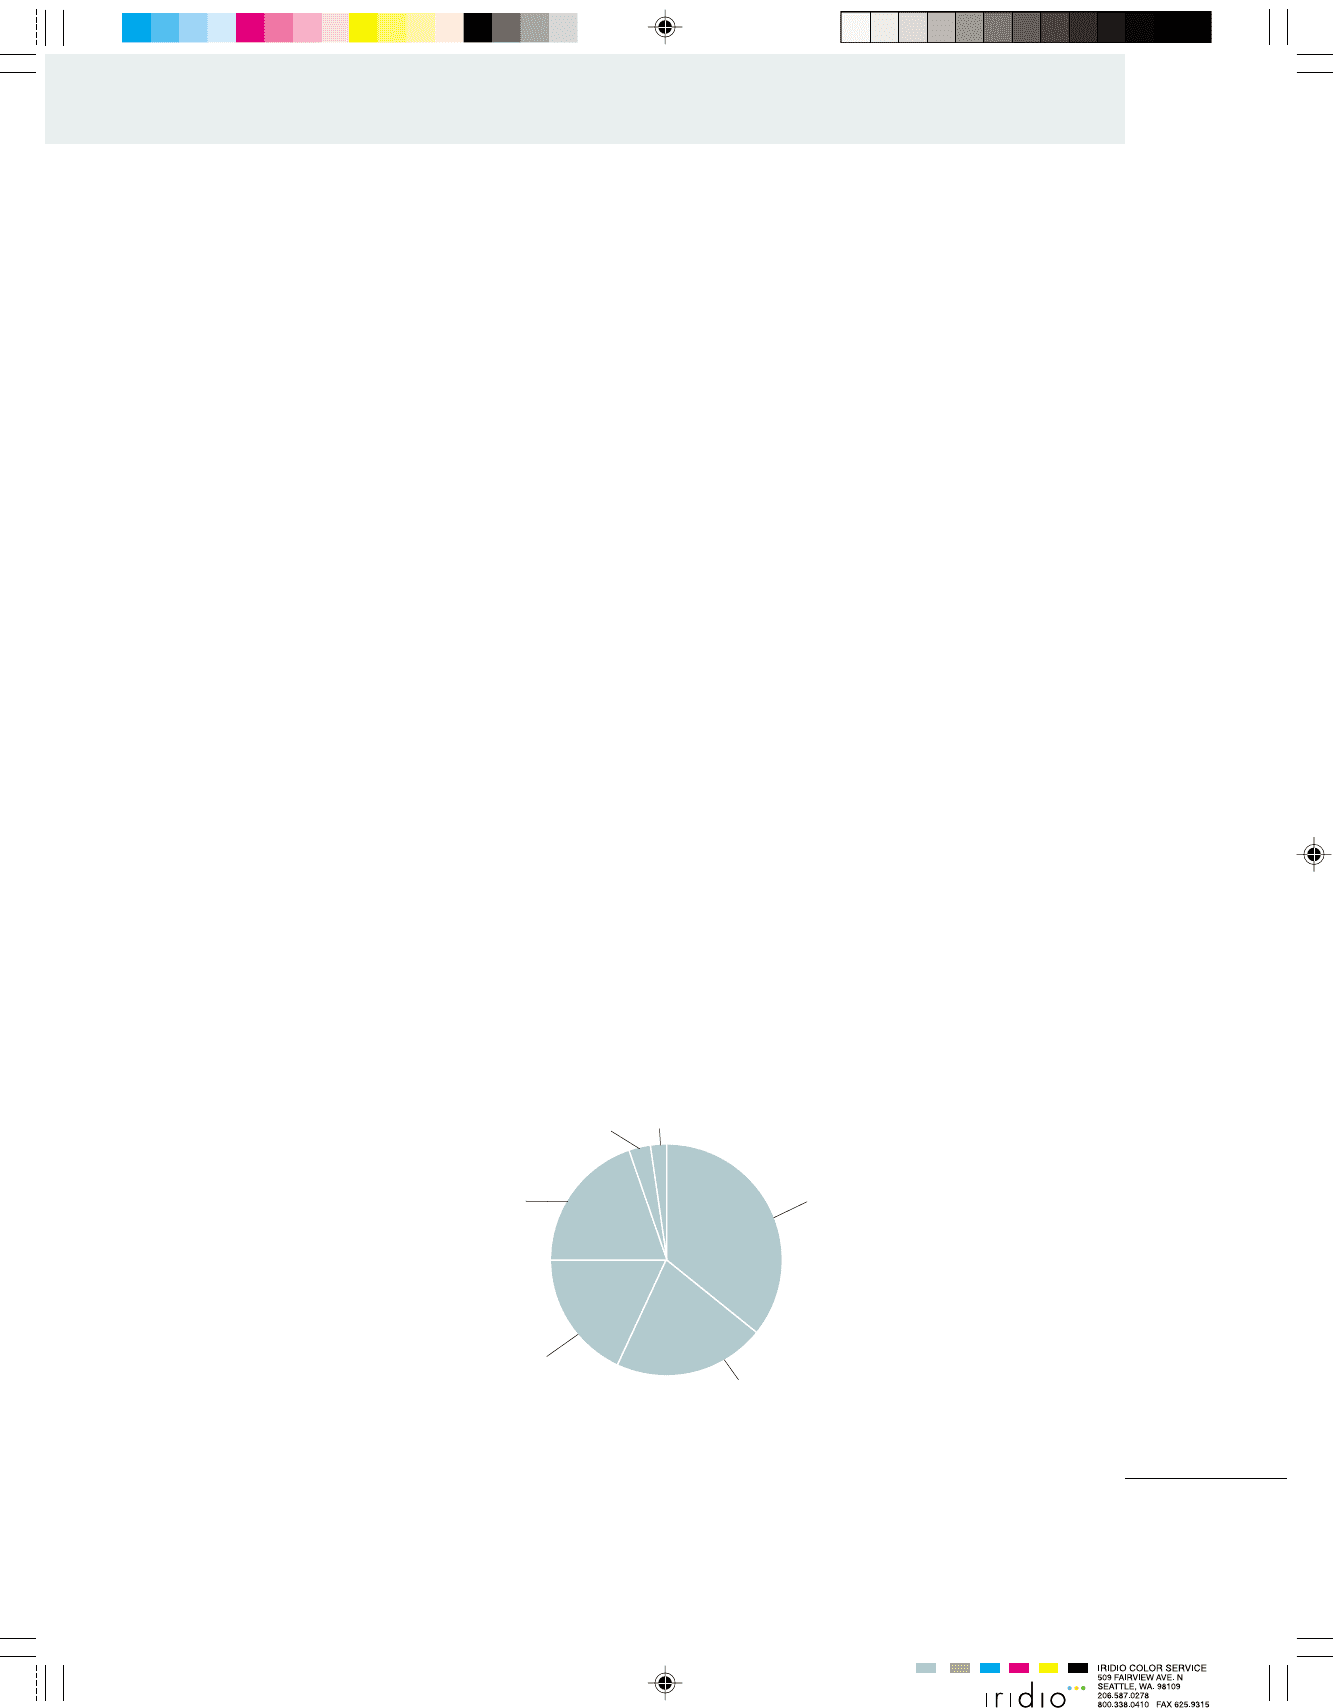
PERCENTAGE OF 2000 SALES BY MERCHANDISE CATEGORY
21% Women’s Accessories
4% Children’s Apparel and Accessories
18% Men’s Apparel and Furnishings 35% Women’s Apparel
19% Shoes
3% Other
NORDSTROM, INC. AND SUBSIDIARIES
Nordstrom.com continued to contribute to the Company’s
sales growth with revenues of $311 million, $235 million
and $215 million in 2000, 1999 and 1998, respectively.
The Company’s average price point has varied slightly over
the past three years, due primarily to changes in the
merchandise mix. Inflation in overall merchandise costs and
prices has not been significant during the past three years.
Gross Profit
Gross profit (net sales less cost of sales and related buying
and occupancy expenses) as a percentage of net sales
declined to 34.0% in 2000, as compared to 34.8% in 1999,
and 33.8% in 1998.
The decline in 2000 is attributable to lower than anticipated
sales, which also resulted in increased markdowns in order to
liquidate excess inventory. The 1999 improvement reflects
changes in the Company’s buying processes and vendor
programs, which was partially offset by increased occupancy
costs related to new stores and remodeling projects.
Selling, General and Administrative
Selling, general and administrative expenses as a percentage
of net sales were 31.6% in 2000, 29.6% in 1999, and
28.3% in 1998.
The increase in 2000, as a percentage of net sales, includes
third quarter charges of approximately $10 million (pre-tax)
related to the write-off of abandoned and impaired
information technology projects, and approximately $13
million (pre-tax) of employee severance and other costs
related to a change in management. In addition, increased
costs in the areas of selling, credit, sales promotion, and
information services accounted for the majority of the
increase in the expense.
The 1999 increase, as a percentage of net sales, was
partially due to a charge of approximately $10 million
(pre-tax) primarily associated with the restructuring of the
Company’s information technology services area in order to
improve its efficiency and effectiveness. The Company also
experienced substantially increased operating expenses of
approximately $23 million, associated with the increased
sales activity of Nordstrom.com and Nordstromshoes.com.
These increases were partially offset by lower bad debt
expense due to the improved credit quality of the Company’s
credit card receivables.