Nordstrom 2000 Annual Report Download - page 29
Download and view the complete annual report
Please find page 29 of the 2000 Nordstrom annual report below. You can navigate through the pages in the report by either clicking on the pages listed below, or by using the keyword search tool below to find specific information within the annual report.-
 1
1 -
2
-
3
-
4
-
5
-
6
-
7
-
8
-
9
-
10
-
11
-
12
-
13
-
14
-
15
-
16
-
17
-
18
-
 19
19 -
 20
20 -
 21
21 -
 22
22 -
 23
23 -
 24
24 -
 25
25 -
 26
26 -
 27
27 -
 28
28 -
 29
29 -
 30
30 -
 31
31 -
 32
32 -
 33
33 -
 34
34 -
 35
35 -
 36
36 -
 37
37 -
 38
38 -
 39
39 -
40
-
41
-
42
-
43
-
44
-
45
-
46
-
47
-
48
 |
 |

Cyan Mag Yelo Blk
20100444 Nordstrom
2001 Annual Report • 44pgs. + 4 covers pg. 27
8.375 x 10.875 • PDF • 150 lpi
PMS
5773
PMS
5503
27
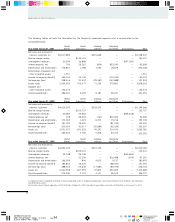
NORDSTROM, INC. AND SUBSIDIARIES
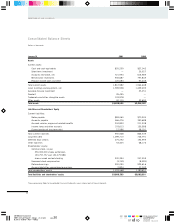
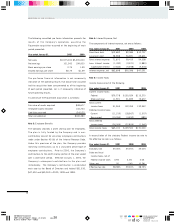
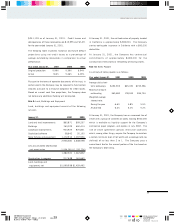
Deferred income tax assets and liabilities result from
temporary differences in the timing of recognition of revenue
and expenses for tax and financial reporting purposes.
Significant deferred tax assets and liabilities, by nature of
the temporary differences giving rise thereto, are as follows:
January 31, 2001 2000
Accrued expenses $28,658 $29,276
Compensation and
benefits accruals 43,803 35,651
Merchandise inventories 26,290 24,461
Realized loss on investment 12,751 —
Other 23,098 15,595
Total deferred tax assets 134,600 104,983
Land, buildings and
equipment basis and
depreciation differences (25,678) (22,982)
Employee benefits (10,937) (11,008)
Unrealized gain on investment — (10,889)
Other (3,748) (3,025)
Total deferred tax liabilities (40,363) (47,904)
Net deferred tax assets $94,237 $57,079
As of January 31, 2001, the Company has $34,357 of
capital loss carryforwards available to be utilized within five
years to reduce future capital gain income. No valuation
allowance has been provided because management believes
it is more likely than not that the full benefit of the
carryforwards will be realized.
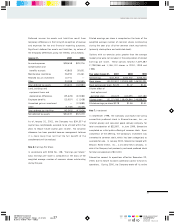
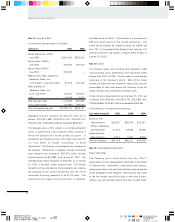
Note 6: Earnings Per Share
In accordance with SFAS No. 128, “Earnings per Share,”
basic earnings per share is computed on the basis of the
weighted average number of common shares outstanding
during the year.
Diluted earnings per share is computed on the basis of the
weighted average number of common shares outstanding
during the year plus dilutive common stock equivalents
(primarily stock options and restricted stock).
Options with an exercise price greater than the average
market price were not included in the computation of diluted
earnings per share. These options totaled 7,409,387
2,798,966 and 1,146,113 shares in 2000, 1999 and
1998.
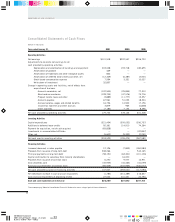
Year ended January 31, 2001 2000 1999
Net earnings $101,918 $202,557 $206,723
Basic shares 131,012,412 137,814,589 146,241,091
Basic earnings per share $0.78 $1.47 $1.41
Dilutive effect of
stock options and
restricted stock 100,673 610,255 617,180
Diluted shares 131,113,085 138,424,844 146,858,271
Diluted earnings per share $0.78 $1.46 $1.41
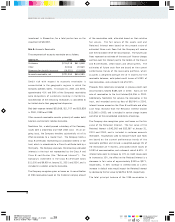
Note 7: Investment
In September 1998, the Company purchased non-voting
convertible preferred stock in Streamline.com, Inc., an
Internet grocery and consumer goods delivery company, for
total consideration of $22,857. In June 1999, Streamline
completed an initial public offering of common stock. Upon
completion of the offering, the Company’s investment was
converted to common stock, which has been categorized as
available-for-sale. In January 2000, Streamline merged with
Beacon Home Direct, Inc., a privately-held company, in
which the Company had previously purchased preferred stock
for total consideration of $10,000.
Streamline ceased its operations effective November 22,
2000, due to failure to obtain additional capital to fund its
operations. During 2000, the Company wrote off its entire