Nordstrom 2000 Annual Report Download - page 2
Download and view the complete annual report
Please find page 2 of the 2000 Nordstrom annual report below. You can navigate through the pages in the report by either clicking on the pages listed below, or by using the keyword search tool below to find specific information within the annual report.-
 1
1 -
 2
2 -
 3
3 -
 4
4 -
 5
5 -
 6
6 -
 7
7 -
 8
8 -
 9
9 -
 10
10 -
 11
11 -
 12
12 -
 13
13 -
14
-
15
-
16
-
17
-
18
-
19
-
20
-
21
-
22
-
23
-
24
-
25
-
26
-
27
-
28
-
29
-
30
-
31
-
32
-
33
-
34
-
35
-
36
-
37
-
38
-
39
-
40
-
41
-
42
-
43
-
44
-
45
-
46
-
47
-
48
 |
 |
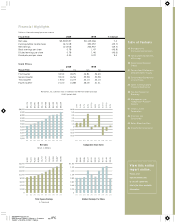
Stock Prices
2000 1999
Fiscal Year high low high low
First Quarter 34.50 18.25 44.81 34.63
Second Quarter 30.00 16.56 39.38 30.38
Third Quarter 19.50 14.19 33.13 23.13
Fourth Quarter 21.00 14.88 28.00 21.31
Financial Highlights
Dollars in thousands except per share amounts
Fiscal Year 2000 1999 % Change
Net sales $5,528,537 $5,149,266 7.4
Earnings before income taxes 167,018 332,057 (49.7)
Net earnings 101,918 202,557 (49.7)
Basic earnings per share 0.78 1.47 (46.9)
Diluted earnings per share 0.78 1.46 (46.6)
Dividends paid per share 0.35 0.32 9.4
20100444 Nordstrom
2001 Annual Report • 44pgs. + 4 covers pg. IFC
16.937 x 10.875 • DCS2 • 150 lpi
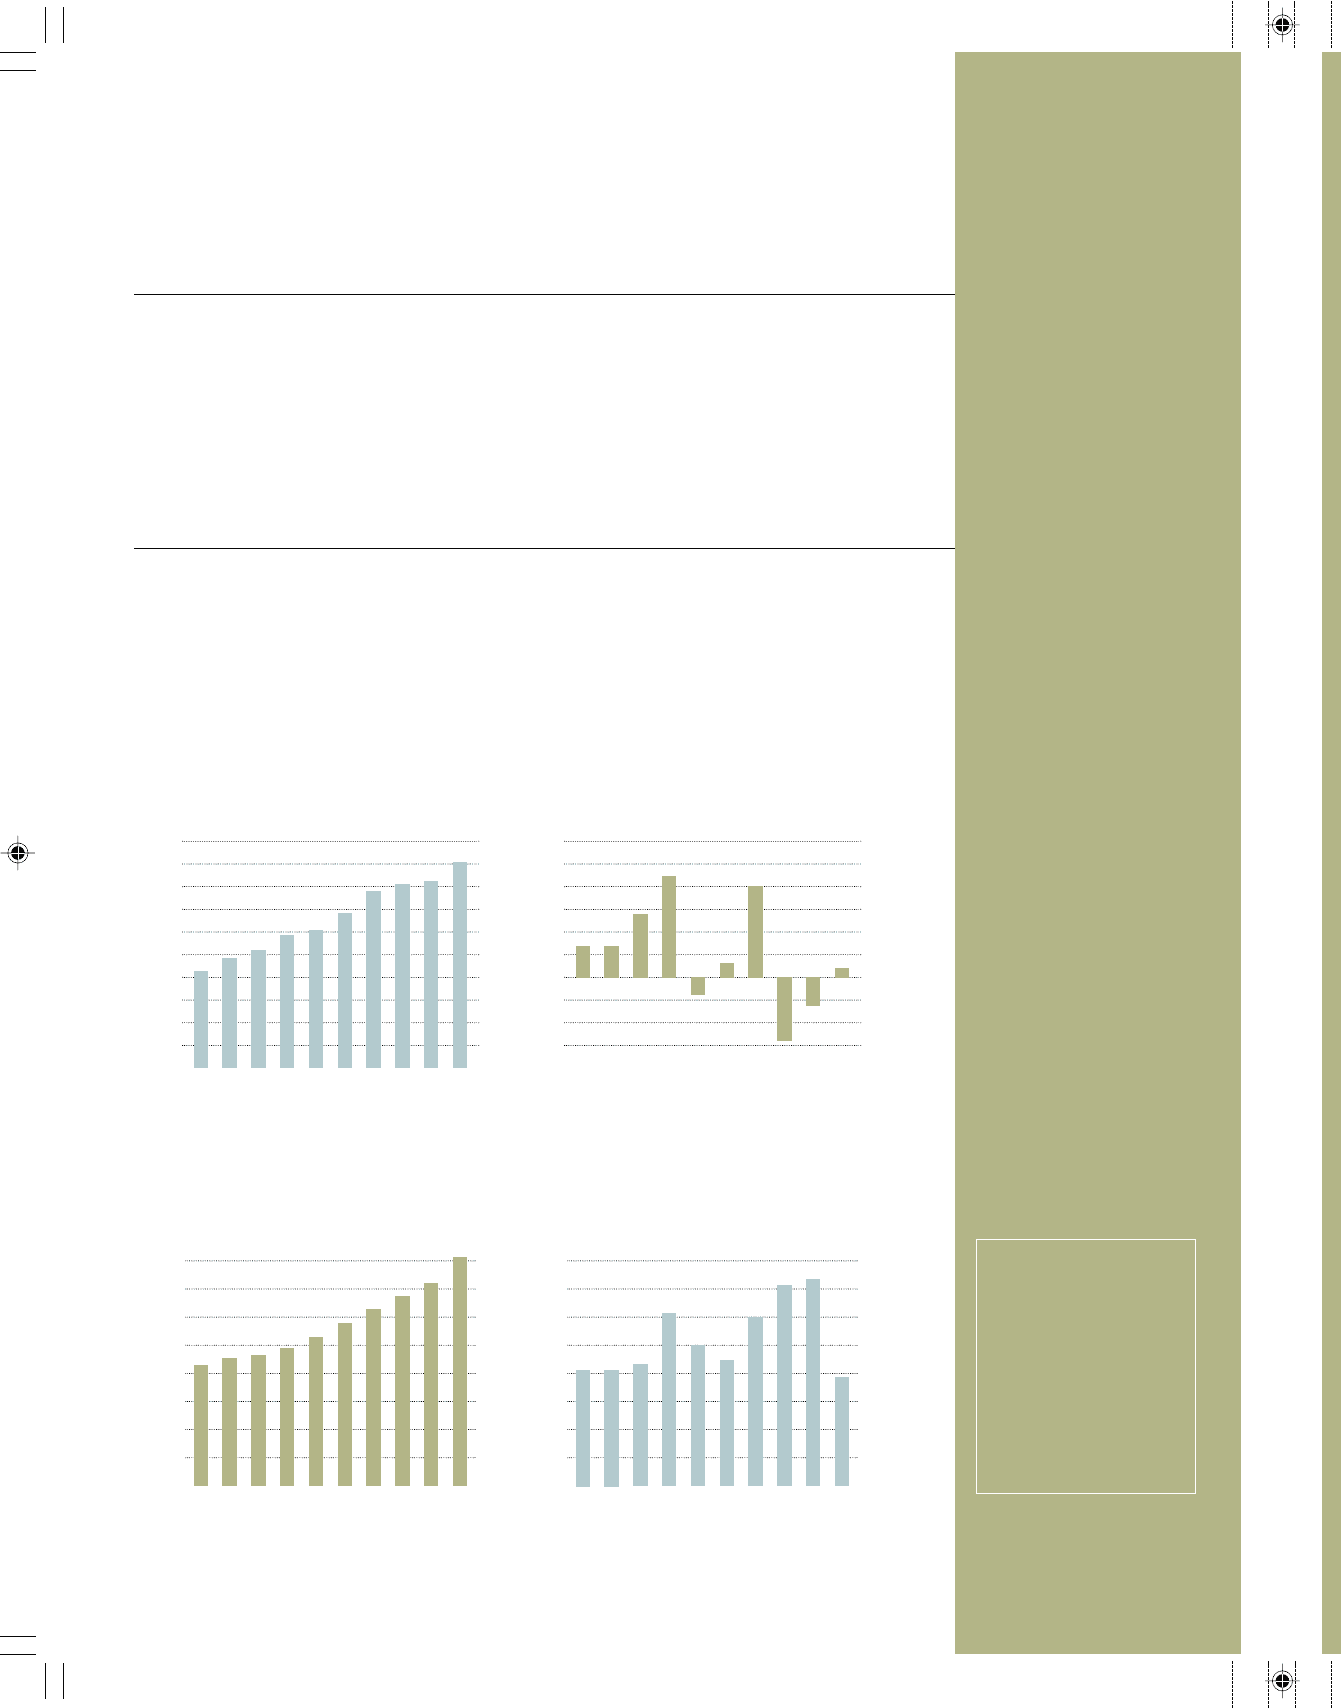
16,000
14,000
12,000
10,000
8,000
6,000
4,000
2,000
0
1991 1992 1993 1994 1995 1996 1997 1998 1999 2000
$3,175
$3,416
$3,591
$3,896
$4,114
$4,458
$4,865
$5,049
$5,149
$5,529
$6,000
5,500
5,000
4,500
4,000
3,500
3,000
2,500
2,000
1,500
1,000
Net Sales
Dollars in Millions
1991 1992 1993 1994 1995 1996 1997 1998 1999 2000
8,590
9,224
9,282
9,998
10,713
11,754
12,614
13,593
14,487
16,056
Total Square Footage
In Thousands
$1.60
1.40
1.20
1.00
0.80
0.60
0.40
0.20
0
1991 1992 1993 1994 1995 1996 1997 1998 1999 2000
$0.82
$0.82
$0.86
$1.23
$1.00
$0.90
$1.20
$1.41
$1.46
$0.78
Diluted Earnings Per Share
1991 1992 1993 1994 1995 1996 1997 1998 1999 2000
1.4%
1.4%
2.7%
4.4%
(0.7%)
0.6%
4.0%
(2.7%)
(1.1%)
0.3%
%6.0
5.0
4.0
3.0
2.0
1.0
0
(1.0)
(2.0)
(3.0)
Comparable Store Sales
Table of Contents
14 Management’s
Discussion and Analysis
19 Consolidated Statements
of Earnings
20 Consolidated Balance
Sheets
21 Consolidated Statements
of Shareholders’ Equity
22 Consolidated Statements
of Cash Flows
23 Notes to Consolidated
Financial Statements
38 Ten-Year Statistical
Summary
40 Management and
Independent Auditors’
Reports
41 Officers of the
Corporation
42 Directors and
Committees
43 Retail Store Facilities
45 Shareholder Information
View this entire
report online.
Please visit
www.nordstrom.com
to see this report and
obtain the latest available
information.
Nordstrom, Inc. common stock is traded on the New York Stock Exchange
NYSE Symbol-JWN.