Nordstrom 2000 Annual Report Download - page 36
Download and view the complete annual report
Please find page 36 of the 2000 Nordstrom annual report below. You can navigate through the pages in the report by either clicking on the pages listed below, or by using the keyword search tool below to find specific information within the annual report.-
 1
1 -
2
-
3
-
4
-
5
-
6
-
7
-
8
-
9
-
10
-
11
-
12
-
13
-
14
-
15
-
16
-
17
-
18
-
19
-
20
-
21
-
22
-
23
-
24
-
25
-
 26
26 -
 27
27 -
 28
28 -
 29
29 -
 30
30 -
 31
31 -
 32
32 -
 33
33 -
 34
34 -
 35
35 -
 36
36 -
 37
37 -
 38
38 -
 39
39 -
 40
40 -
 41
41 -
 42
42 -
 43
43 -
 44
44 -
 45
45 -
 46
46 -
47
-
48
 |
 |

Cyan Mag Yelo Blk
20100444 Nordstrom
2001 Annual Report • 44pgs. + 4 covers pg. 34
8.375 x 10.875 • PDF • 150 lpi
PMS
5773
PMS
5503
34
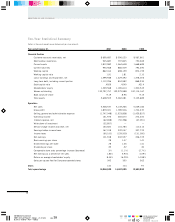
NORDSTROM, INC. AND SUBSIDIARIES
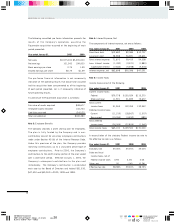
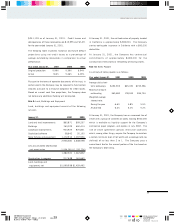
Retail Credit Catalog/ Corporate
Year ended January 31, 2001 Stores Operations Internet and Other Eliminations Total
Net sales and revenues to
external customers (b) $5,217,889 — $310,648 — — $5,528,537
Service charge income — $135,121 — — — 135,121
Intersegment revenues 30,294 26,889 — — $(57,183) —
Interest expense, net 795 29,267 (604) $33,240 — 62,698
Depreciation and amortization 176,831 1,786 7,552 16,879 — 203,048
Amortization of goodwill and
other intangible assets 1,251 — — — — 1,251
Income tax expense (benefit) 165,150 13,140 — (113,190) — 65,100
Net earnings (loss) 258,416 20,557 (29,367) (147,688) — 101,918
Assets (a)(b) 2,554,393 703,077 71,233 279,800 — 3,608,503
Goodwill and
other intangible assets 143,473 — — — — 143,473
Capital expenditures 286,941 3,095 5,187 26,231 — 321,454
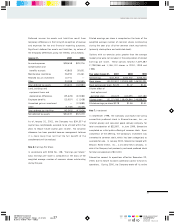
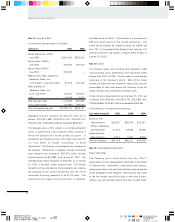
Retail Credit Catalog/ Corporate
Year ended January 31, 2000 Stores Operations Internet and Other Eliminations Total
Net sales and revenues to
external customers $4,914,293 — $234,973 — — $5,149,266
Service charge income — $125,727 — — — 125,727
Intersegment revenues 20,285 25,963 — — $(46,248) —
Interest expense, net 728 26,933 (167) $22,902 — 50,396
Depreciation and amortization 170,765 1,424 6,313 15,216 — 193,718
Income tax expense (benefit) 191,790 19,450 — (81,740) — 129,500
Net earnings (loss) 300,009 30,417 (35,685) (92,184) — 202,557
Assets (a) 2,051,327 601,320 95,241 314,193 — 3,062,081
Capital expenditures 263,352 2,792 5,206 33,702 — 305,052
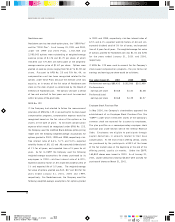
Retail Credit Catalog/ Corporate
Year ended January 31, 1999 Stores Operations Internet and Other Eliminations Total
Net sales and revenues to
external customers $4,834,049 — $215,133 — — $5,049,182
Service charge income — $123,201 — — — 123,201
Intersegment revenues 23,748 26,736 — — $(50,484) —
Interest expense, net — 31,139 — $16,488 (536) 47,091
Depreciation and amortization 166,099 806 4,613 9,137 — 180,655
Income tax expense (benefit) 182,800 16,200 — (68,000) — 131,000
Net earnings (loss) 288,503 25,606 (17,681) (89,705) — 206,723
Assets (a) 2,040,938 607,255 57,803 397,693 —3,103,689
Capital expenditures 273,906 2,191 4,121 26,519 — 306,737
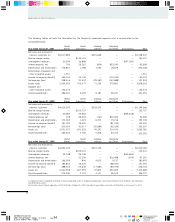
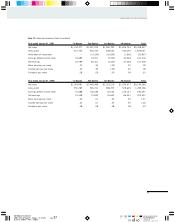
The following tables set forth the information for the Company’s reportable segments and a reconciliation to the
consolidated totals:
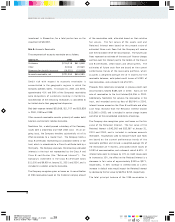
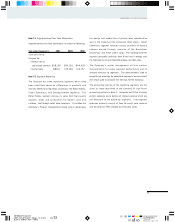
(a) Segment assets in Corporate and Other include unallocated assets in corporate headquarters, consisting primarily of land, buildings and equipment,
and deferred tax assets.
(b) Includes sales of foreign operations of $12,318 from October 24, 2000, the date of acquisition, and assets of $206,601 as of January 31, 2001.