Nordstrom 2000 Annual Report Download - page 24
Download and view the complete annual report
Please find page 24 of the 2000 Nordstrom annual report below. You can navigate through the pages in the report by either clicking on the pages listed below, or by using the keyword search tool below to find specific information within the annual report.-
 1
1 -
2
-
3
-
4
-
5
-
6
-
7
-
8
-
9
-
10
-
11
-
12
-
13
-
 14
14 -
 15
15 -
 16
16 -
 17
17 -
 18
18 -
 19
19 -
 20
20 -
 21
21 -
 22
22 -
 23
23 -
 24
24 -
 25
25 -
 26
26 -
 27
27 -
 28
28 -
 29
29 -
 30
30 -
 31
31 -
 32
32 -
 33
33 -
 34
34 -
35
-
36
-
37
-
38
-
39
-
40
-
41
-
42
-
43
-
44
-
45
-
46
-
47
-
48
 |
 |

Cyan Mag Yelo Blk
20100444 Nordstrom
2001 Annual Report • 44pgs. + 4 covers pg. 22
8.375 x 10.875 • PDF • 150 lpi
PMS
5773
PMS
5503
22
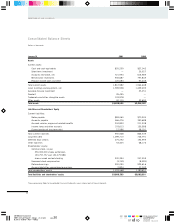
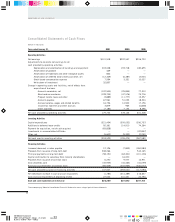
NORDSTROM, INC. AND SUBSIDIARIES
Consolidated Statements of Cash Flows
Dollars in thousands
Year ended January 31, 2001 2000 1999
Operating Activities
Net earnings $101,918 $202,557 $206,723
Adjustments to reconcile net earnings to net
cash provided by operating activities:
Depreciation and amortization of buildings and equipment 203,048 193,718 180,655
Amortization of goodwill 429 — —
Amortization of trademark and other intangible assets 822 — —
Amortization of deferred lease credits and other, net (12,349) (6,387) (3,501)
Stock-based compensation expense 7,594 3,331 10,037
Write-down of investment 32,857 — —
Change in operating assets and liabilities, net of effects from
acquisition of business
Accounts receivable, net (102,945) (29,854) 77,313
Merchandise inventories (128,744) (47,576) 75,776
Prepaid income taxes and other (3,889) (11,777) 15,357
Accounts payable 67,561 51,053 18,324
Accrued salaries, wages and related benefits 16,736 14,942 17,156
Income tax liabilities and other accruals 3,879 965 (4,828)
Other liabilities (7,184) 7,154 8,296
Net cash provided by operating activities 179,733 378,126 601,308
Investing Activities
Capital expenditures (321,454) (305,052) (306,737)
Additions to deferred lease credits 92,361 114,910 74,264
Payment for acquisition, net of cash acquired (83,828) — —
Investments in unconsolidated affiliates — — (32,857)
Other, net (5,602) (9,332) (2,251)
Net cash used in investing activities (318,523) (199,474) (267,581)
Financing Activities
Increase (decrease) in notes payable 12,126 (7,849) (184,984)
Proceeds from issuance of long-term debt 308,266 — 544,165
Principal payments on long-term debt (58,191) (63,341) (101,106)
Capital contribution to subsidiary from minority shareholders — 16,000 —
Proceeds from issuance of common stock 6,250 9,577 14,971
Cash dividends paid (45,935) (44,463) (44,059)
Purchase and retirement of common stock (85,509) (302,965) (346,077)
Net cash provided by (used in) financing activities 137,007 (393,041) (117,090)
Net (decrease) increase in cash and cash equivalents (1,783) (214,389) 216,637
Cash and cash equivalents at beginning of year 27,042 241,431 24,794
Cash and cash equivalents at end of year $25,259 $27,042 $241,431
The accompanying Notes to Consolidated Financial Statements are an integral part of these statements.