MoneyGram 2009 Annual Report Download - page 52
Download and view the complete annual report
Please find page 52 of the 2009 MoneyGram annual report below. You can navigate through the pages in the report by either clicking on the pages listed below, or by using the keyword search tool below to find specific information within the annual report.-
 1
1 -
2
-
3
-
4
-
5
-
6
-
7
-
8
-
9
-
10
-
11
-
12
-
13
-
14
-
15
-
16
-
17
-
18
-
19
-
20
-
21
-
22
-
23
-
24
-
25
-
26
-
27
-
28
-
29
-
30
-
31
-
32
-
33
-
34
-
35
-
36
-
37
-
38
-
39
-
40
-
41
-
 42
42 -
 43
43 -
 44
44 -
 45
45 -
 46
46 -
 47
47 -
 48
48 -
 49
49 -
 50
50 -
 51
51 -
 52
52 -
 53
53 -
 54
54 -
 55
55 -
 56
56 -
 57
57 -
 58
58 -
 59
59 -
 60
60 -
 61
61 -
 62
62 -
63
-
64
-
65
-
66
-
67
-
68
-
69
-
70
-
71
-
72
-
73
-
74
-
75
-
76
-
77
-
78
-
79
-
80
-
81
-
82
-
83
-
84
-
85
-
86
-
87
-
88
-
89
-
90
-
91
-
92
-
93
-
94
-
95
-
96
-
97
-
98
-
99
-
100
-
101
-
102
-
103
-
104
-
105
-
106
-
107
-
108
-
109
-
110
-
111
-
112
-
113
-
114
-
115
-
116
-
117
-
118
-
119
-
120
-
121
-
122
-
123
-
124
-
125
-
126
-
127
-
128
-
129
-
130
-
131
-
132
-
133
-
134
-
135
-
136
-
137
-
138
-
139
-
140
-
141
-
142
-
143
-
144
-
145
-
146
-
147
-
148
-
149
-
150
-
151
-
152
-
153
-
154
-
155
-
156
-
157
-
158
-
159
-
160
-
161
-
162
-
163
-
164
-
165
-
166
-
167
-
168
-
169
-
170
-
171
-
172
-
173
-
174
-
175
-
176
-
177
-
178
-
179
-
180
-
181
-
182
-
183
-
184
-
185
-
186
-
187
-
188
-
189
-
190
-
191
-
192
-
193
-
194
-
195
-
196
-
197
-
198
-
199
-
200
-
201
-
202
-
203
-
204
-
205
-
206
-
207
-
208
-
209
-
210
-
211
-
212
-
213
-
214
-
215
-
216
-
217
-
218
-
219
-
220
-
221
-
222
-
223
-
224
-
225
-
226
-
227
-
228
-
229
-
230
-
231
-
232
-
233
-
234
-
235
-
236
-
237
-
238
-
239
-
240
-
241
-
242
-
243
-
244
-
245
-
246
-
247
-
248
-
249
-
250
-
251
-
252
-
253
-
254
-
255
-
256
-
257
-
258
-
259
-
260
-
261
-
262
-
263
-
264
-
265
-
266
-
267
-
268
-
269
-
270
-
271
-
272
-
273
-
274
-
275
-
276
-
277
-
278
-
279
-
280
-
281
-
282
-
283
-
284
-
285
-
286
-
287
-
288
-
289
-
290
-
291
-
292
-
293
-
294
-
295
-
296
-
297
-
298
-
299
-
300
-
301
-
302
-
303
-
304
-
305
-
306
-
307
-
308
-
309
-
310
-
311
-
312
-
313
-
314
-
315
-
316
-
317
-
318
-
319
-
320
-
321
-
322
-
323
-
324
-
325
-
326
-
327
-
328
-
329
-
330
-
331
-
332
-
333
-
334
-
335
-
336
-
337
-
338
-
339
-
340
-
341
-
342
-
343
-
344
-
345
-
346
-
347
-
348
-
349
-
350
-
351
-
352
-
353
-
354
-
355
-
356
-
357
-
358
-
359
-
360
-
361
-
362
-
363
-
364
-
365
-
366
-
367
-
368
-
369
-
370
-
371
-
372
-
373
-
374
-
375
-
376
-
377
-
378
-
379
-
380
-
381
-
382
-
383
-
384
-
385
-
386
-
387
-
388
-
389
-
390
-
391
-
392
-
393
-
394
-
395
-
396
-
397
-
398
-
399
-
400
-
401
-
402
-
403
-
404
-
405
-
406
-
407
-
408
-
409
-
410
-
411
-
412
-
413
-
414
-
415
-
416
-
417
-
418
-
419
-
420
-
421
-
422
-
423
-
424
-
425
-
426
-
427
-
428
-
429
-
430
-
431
-
432
-
433
-
434
-
435
-
436
-
437
-
438
-
439
-
440
-
441
-
442
-
443
-
444
-
445
-
446
-
447
-
448
-
449
-
450
-
451
-
452
-
453
-
454
-
455
-
456
-
457
-
458
-
459
-
460
-
461
-
462
-
463
-
464
-
465
-
466
-
467
-
468
-
469
-
470
-
471
-
472
-
473
-
474
-
475
-
476
-
477
-
478
-
479
-
480
-
481
-
482
-
483
-
484
-
485
-
486
-
487
-
488
-
489
-
490
-
491
-
492
-
493
-
494
-
495
-
496
-
497
-
498
-
499
-
500
-
501
-
502
-
503
-
504
-
505
-
506
-
507
-
508
-
509
-
510
-
511
-
512
-
513
-
514
-
515
-
516
-
517
-
518
-
519
-
520
-
521
-
522
-
523
-
524
-
525
-
526
-
527
-
528
-
529
-
530
-
531
-
532
-
533
-
534
-
535
-
536
-
537
-
538
-
539
-
540
-
541
-
542
-
543
-
544
-
545
-
546
-
547
-
548
-
549
-
550
-
551
-
552
-
553
-
554
-
555
-
556
-
557
-
558
-
559
-
560
-
561
-
562
-
563
-
564
-
565
-
566
-
567
-
568
-
569
-
570
-
571
-
572
-
573
-
574
-
575
-
576
-
577
-
578
-
579
-
580
-
581
-
582
-
583
-
584
-
585
-
586
-
587
-
588
-
589
-
590
-
591
-
592
-
593
-
594
-
595
-
596
-
597
-
598
-
599
-
600
-
601
-
602
-
603
-
604
-
605
-
606
-
607
-
608
-
609
-
610
-
611
-
612
-
613
-
614
-
615
-
616
-
617
-
618
-
619
-
620
-
621
-
622
-
623
-
624
-
625
-
626
-
627
-
628
-
629
-
630
-
631
-
632
-
633
-
634
-
635
-
636
-
637
-
638
-
639
-
640
-
641
-
642
-
643
-
644
-
645
-
646
-
647
-
648
-
649
-
650
-
651
-
652
-
653
-
654
-
655
-
656
-
657
-
658
-
659
-
660
-
661
-
662
-
663
-
664
-
665
-
666
-
667
-
668
-
669
-
670
-
671
-
672
-
673
-
674
-
675
-
676
-
677
-
678
-
679
-
680
-
681
-
682
-
683
-
684
-
685
-
686
-
687
-
688
-
689
-
690
-
691
-
692
-
693
-
694
-
695
-
696
-
697
-
698
-
699
-
700
-
701
-
702
-
703
-
704
-
705
-
706
 |
 |
Table of Contents
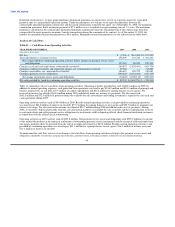
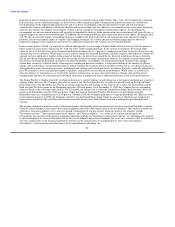
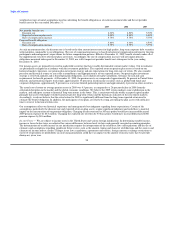
Table 12 — Cash Flows from Investing Activities
YEAR ENDED DECEMBER 31, 2009 2008 2007
(Amounts in thousands)
Net investment activity $ 140,999 $ 3,389,331 $ 318,716
Purchases of property and equipment (37,948) (38,470) (70,457)
Cash paid for acquisitions, net of cash acquired (3,210) (2,928) (29,212)
Proceeds from sale of business 4,500 — —
Net cash provided by investing activities $ 104,341 $ 3,347,933 $ 219,047
Table 12 summarizes the net cash flows from investing activities, primarily consisting of activity within our investment portfolio.
Investing activities provided cash of $104.3 million in 2009. For 2009, investing activities relate primarily to $141.0 million of proceeds
from the maturity of available-for-sale investments. For 2008, investing activities relate primarily to $2.9 billion of proceeds from the
realignment of the investment portfolio and $493.3 million of proceeds from the normal maturity of available-for-sale investments. These
proceeds in both 2009 and 2008 were reinvested in cash and cash equivalents. Net investment activity in 2007 represents $1.1 billion of
proceeds from normal maturities and sales of investments, of which $758.9 million was reinvested into the long-term portfolio. The
excess proceeds of $318.7 million in 2007 were reinvested in cash and cash equivalents.
Other investing activity consisted of capital expenditures of $37.9 million, $38.5 million and $70.5 million for 2009, 2008 and 2007,
respectively, for agent equipment, signage and infrastructure to support the growth of the business and development of software related to
our continued investment in the money transfer platform and compliance activities. Included in the Consolidated Balance Sheets under
"Accounts payable and other liabilities" and "Property and equipment" is $1.2 million of property and equipment received by the
Company, but not paid as of December 31, 2009. These amounts were paid in January 2010. We expect our total capital expenditures in
2010 to range from approximately $40.0 million to $65.0 million as we continue to invest in our technology infrastructure and agent
network to support future growth and address regulatory trends. In 2008, we acquired two of our super-agents in Spain, MoneyCard and
Cambios Sol, for $2.9 million (net of cash acquired of $5.5 million). In 2007, we acquired PropertyBridge for $28.1 million and also paid
the remaining $1.1 million of purchase price for ACH Commerce, which was to be paid upon the second anniversary of the acquisition.
Table 13 — Cash Flows from Financing Activities
YEAR ENDED DECEMBER 31, 2009 2008 2007
(Amounts in thousands)
Net proceeds from the issuance of debt $ — $ 685,945 $ —
Payment on debt (41,875) (1,875) —
Net (payments on) proceeds from credit facilities (145,000) (100,000) 195,000
Net proceeds from the issuance of preferred stock — 707,778 —
Proceeds and tax benefit from exercise of stock options — — 7,674
Purchase of treasury stock — — (45,992)
Cash dividends paid — — (16,625)
Net cash (used in) provided by financing activities $ (186,875) $ 1,291,848 $ 140,057
Table 13 summarizes the net cash flows from financing activities. In 2009, we made payments totaling $145.0 million to pay down our
revolving credit facility and payments of $41.9 million on Tranche B, consisting of a $40.0 million prepayment and $1.9 million of
quarterly payments. In 2008, financing activities generated $1.4 billion of cash from the recapitalization, net of $100.0 million of related
transaction costs. From these proceeds, we paid $101.9 million toward the Senior Facility; the remaining proceeds were invested in cash
and cash equivalents as shown in Table 11 — Cash Flows from Operating Activities. In 2007, we borrowed $195.0 million under our
Senior Facility. There were no proceeds received from the exercise of options or release of restricted stock, purchases of treasury stock or
payment of dividends in 2009 and 2008. We generated $7.7 million of proceeds in 2007 from the exercise of stock options and release of
restricted stock, including related tax benefits of
49