MoneyGram 2009 Annual Report Download - page 33
Download and view the complete annual report
Please find page 33 of the 2009 MoneyGram annual report below. You can navigate through the pages in the report by either clicking on the pages listed below, or by using the keyword search tool below to find specific information within the annual report.-
 1
1 -
2
-
3
-
4
-
5
-
6
-
7
-
8
-
9
-
10
-
11
-
12
-
13
-
14
-
15
-
16
-
17
-
18
-
19
-
20
-
21
-
22
-
 23
23 -
 24
24 -
 25
25 -
 26
26 -
 27
27 -
 28
28 -
 29
29 -
 30
30 -
 31
31 -
 32
32 -
 33
33 -
 34
34 -
 35
35 -
 36
36 -
 37
37 -
 38
38 -
 39
39 -
 40
40 -
 41
41 -
 42
42 -
 43
43 -
44
-
45
-
46
-
47
-
48
-
49
-
50
-
51
-
52
-
53
-
54
-
55
-
56
-
57
-
58
-
59
-
60
-
61
-
62
-
63
-
64
-
65
-
66
-
67
-
68
-
69
-
70
-
71
-
72
-
73
-
74
-
75
-
76
-
77
-
78
-
79
-
80
-
81
-
82
-
83
-
84
-
85
-
86
-
87
-
88
-
89
-
90
-
91
-
92
-
93
-
94
-
95
-
96
-
97
-
98
-
99
-
100
-
101
-
102
-
103
-
104
-
105
-
106
-
107
-
108
-
109
-
110
-
111
-
112
-
113
-
114
-
115
-
116
-
117
-
118
-
119
-
120
-
121
-
122
-
123
-
124
-
125
-
126
-
127
-
128
-
129
-
130
-
131
-
132
-
133
-
134
-
135
-
136
-
137
-
138
-
139
-
140
-
141
-
142
-
143
-
144
-
145
-
146
-
147
-
148
-
149
-
150
-
151
-
152
-
153
-
154
-
155
-
156
-
157
-
158
-
159
-
160
-
161
-
162
-
163
-
164
-
165
-
166
-
167
-
168
-
169
-
170
-
171
-
172
-
173
-
174
-
175
-
176
-
177
-
178
-
179
-
180
-
181
-
182
-
183
-
184
-
185
-
186
-
187
-
188
-
189
-
190
-
191
-
192
-
193
-
194
-
195
-
196
-
197
-
198
-
199
-
200
-
201
-
202
-
203
-
204
-
205
-
206
-
207
-
208
-
209
-
210
-
211
-
212
-
213
-
214
-
215
-
216
-
217
-
218
-
219
-
220
-
221
-
222
-
223
-
224
-
225
-
226
-
227
-
228
-
229
-
230
-
231
-
232
-
233
-
234
-
235
-
236
-
237
-
238
-
239
-
240
-
241
-
242
-
243
-
244
-
245
-
246
-
247
-
248
-
249
-
250
-
251
-
252
-
253
-
254
-
255
-
256
-
257
-
258
-
259
-
260
-
261
-
262
-
263
-
264
-
265
-
266
-
267
-
268
-
269
-
270
-
271
-
272
-
273
-
274
-
275
-
276
-
277
-
278
-
279
-
280
-
281
-
282
-
283
-
284
-
285
-
286
-
287
-
288
-
289
-
290
-
291
-
292
-
293
-
294
-
295
-
296
-
297
-
298
-
299
-
300
-
301
-
302
-
303
-
304
-
305
-
306
-
307
-
308
-
309
-
310
-
311
-
312
-
313
-
314
-
315
-
316
-
317
-
318
-
319
-
320
-
321
-
322
-
323
-
324
-
325
-
326
-
327
-
328
-
329
-
330
-
331
-
332
-
333
-
334
-
335
-
336
-
337
-
338
-
339
-
340
-
341
-
342
-
343
-
344
-
345
-
346
-
347
-
348
-
349
-
350
-
351
-
352
-
353
-
354
-
355
-
356
-
357
-
358
-
359
-
360
-
361
-
362
-
363
-
364
-
365
-
366
-
367
-
368
-
369
-
370
-
371
-
372
-
373
-
374
-
375
-
376
-
377
-
378
-
379
-
380
-
381
-
382
-
383
-
384
-
385
-
386
-
387
-
388
-
389
-
390
-
391
-
392
-
393
-
394
-
395
-
396
-
397
-
398
-
399
-
400
-
401
-
402
-
403
-
404
-
405
-
406
-
407
-
408
-
409
-
410
-
411
-
412
-
413
-
414
-
415
-
416
-
417
-
418
-
419
-
420
-
421
-
422
-
423
-
424
-
425
-
426
-
427
-
428
-
429
-
430
-
431
-
432
-
433
-
434
-
435
-
436
-
437
-
438
-
439
-
440
-
441
-
442
-
443
-
444
-
445
-
446
-
447
-
448
-
449
-
450
-
451
-
452
-
453
-
454
-
455
-
456
-
457
-
458
-
459
-
460
-
461
-
462
-
463
-
464
-
465
-
466
-
467
-
468
-
469
-
470
-
471
-
472
-
473
-
474
-
475
-
476
-
477
-
478
-
479
-
480
-
481
-
482
-
483
-
484
-
485
-
486
-
487
-
488
-
489
-
490
-
491
-
492
-
493
-
494
-
495
-
496
-
497
-
498
-
499
-
500
-
501
-
502
-
503
-
504
-
505
-
506
-
507
-
508
-
509
-
510
-
511
-
512
-
513
-
514
-
515
-
516
-
517
-
518
-
519
-
520
-
521
-
522
-
523
-
524
-
525
-
526
-
527
-
528
-
529
-
530
-
531
-
532
-
533
-
534
-
535
-
536
-
537
-
538
-
539
-
540
-
541
-
542
-
543
-
544
-
545
-
546
-
547
-
548
-
549
-
550
-
551
-
552
-
553
-
554
-
555
-
556
-
557
-
558
-
559
-
560
-
561
-
562
-
563
-
564
-
565
-
566
-
567
-
568
-
569
-
570
-
571
-
572
-
573
-
574
-
575
-
576
-
577
-
578
-
579
-
580
-
581
-
582
-
583
-
584
-
585
-
586
-
587
-
588
-
589
-
590
-
591
-
592
-
593
-
594
-
595
-
596
-
597
-
598
-
599
-
600
-
601
-
602
-
603
-
604
-
605
-
606
-
607
-
608
-
609
-
610
-
611
-
612
-
613
-
614
-
615
-
616
-
617
-
618
-
619
-
620
-
621
-
622
-
623
-
624
-
625
-
626
-
627
-
628
-
629
-
630
-
631
-
632
-
633
-
634
-
635
-
636
-
637
-
638
-
639
-
640
-
641
-
642
-
643
-
644
-
645
-
646
-
647
-
648
-
649
-
650
-
651
-
652
-
653
-
654
-
655
-
656
-
657
-
658
-
659
-
660
-
661
-
662
-
663
-
664
-
665
-
666
-
667
-
668
-
669
-
670
-
671
-
672
-
673
-
674
-
675
-
676
-
677
-
678
-
679
-
680
-
681
-
682
-
683
-
684
-
685
-
686
-
687
-
688
-
689
-
690
-
691
-
692
-
693
-
694
-
695
-
696
-
697
-
698
-
699
-
700
-
701
-
702
-
703
-
704
-
705
-
706
 |
 |

Table of Contents
we pay to our financial institution customers are variable rate and primarily based on the effective federal funds rate. Accordingly, our
investment commissions expense decreases when rates decline and increases when rates rise. As discussed in "Results of Operations —
Table 3 — Net Investment Revenue Analysis," our net investment margin is based on the spread between the yield earned on our
investment portfolio and the commission rates paid to our financial institution customers. In a declining interest rate environment, our net
investment margin will typically be benefited, while an increasing interest rate environment will typically have a negative impact on our
net investment margin. This is due to the lag between when changes in interest rates impact the two components of the net investment
margin, with commission rates resetting faster than our investment portfolio. In the current environment, the federal funds rate is so low
that most of our financial institution customers are in a "negative" commission position, in that we do not owe any commissions to our
customers. While the vast majority of our contracts require the financial institution customers to pay us for the negative commission
amount, we have opted at this time to impose certain per-item and other fees rather than require payment. We continue to monitor the
negative commissions and may decide to pursue payment at a future date. Finally, our Senior Facility is floating rate debt, and
accordingly, our interest expense will decrease in a declining rate environment and increase when rates rise.
Official Check Restructuring and Repricing — In the first quarter of 2008, we initiated the restructuring of our official check business by
changing the commission structure and exiting certain large customer relationships, particularly our top 10 financial institution
customers. As of December 31, 2009, approximately $1.9 billion of balances for the top 10 customers have run off, with the remaining
balances expected to run off over the next 24 months as these customers cease issuing new official checks and old issuances are presented
to us for payment. Effective June 1, 2008 for most customers and July 1, 2008 for our remaining customers, we reduced the commission
rate paid to the majority of our official check financial institution customers. This repricing results in an average contractual payout rate
of the effective federal funds rate less approximately 85 basis points.
Money Order Repricing and Review — In the fourth quarter of 2008, we initiated the first phase of a repricing initiative for our money
order product sold through retail agent locations. This initiative increases the per-item fee we receive for our money orders and reflects
the impact of the realigned investment portfolio on the profitability of this product. A broader second phase of repricing was initiated in
the second quarter of 2009. In addition, we continue to review our credit exposure to our agents and may terminate or otherwise revise
our relationship with certain agents. As anticipated, money order volumes in 2009 declined from these initiatives. As we continue our
repricing and review efforts, we expect volumes to further decline from the attrition of money order customers.
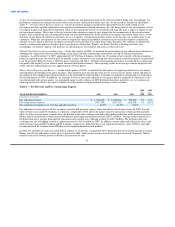
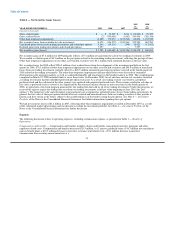
Table 2 — Fee Revenue and Fee Commissions Expense
2009 2008
vs. vs.
YEAR ENDED DECEMBER 31, 2009 2008 2007 2008 2007
(Amounts in thousands)
Fee and other revenue $ 1,130,893 $ 1,105,676 $ 949,059 2% 17%
Fee commissions expense (497,105) (502,317) (410,301) 1% (22)%
Fee commissions expense as a % of fee and other revenue 44.0% 45.4% 43.2%
Fee and other revenue consists of fees on money transfer, bill payment, money order and official check transactions. In 2009, fee and
other revenue increased $25.2 million, or 2 percent, compared to 2008, driven by money transfer transaction volume growth, partially
offset by lower average money transfer fees, the decline in the euro exchange rate and a $6.6 million reduction in bill payment revenue.
Money transfer transaction volume increased 6 percent, generating incremental revenue of $53.3 million. Average money transfer fees
declined from lower average principal per transaction and corridor mix, reducing revenue by $20.7 million. The decline in the euro
exchange rate, net of hedging activities, reduced revenue by $10.9 million in 2009. In addition, money order and official check fee and
other revenue increased $9.3 million and $5.6 million, respectively, primarily due to our repricing initiatives. Also, 2009 fee and other
revenue declined $6.1 million from 2008 due to discontinued businesses and products.
In 2008, fee and other revenue increased $156.6 million, or 17 percent, compared to 2007, primarily driven by growth in money transfer.
Money transfer fee and other revenue grew 19 percent in 2008, while money transfer transaction volume increased 18 percent. Money
transfer transaction volume growth resulted in incremental fee and
30