MoneyGram 2009 Annual Report Download - page 36
Download and view the complete annual report
Please find page 36 of the 2009 MoneyGram annual report below. You can navigate through the pages in the report by either clicking on the pages listed below, or by using the keyword search tool below to find specific information within the annual report.-
 1
1 -
2
-
3
-
4
-
5
-
6
-
7
-
8
-
9
-
10
-
11
-
12
-
13
-
14
-
15
-
16
-
17
-
18
-
19
-
20
-
21
-
22
-
23
-
24
-
25
-
 26
26 -
 27
27 -
 28
28 -
 29
29 -
 30
30 -
 31
31 -
 32
32 -
 33
33 -
 34
34 -
 35
35 -
 36
36 -
 37
37 -
 38
38 -
 39
39 -
 40
40 -
 41
41 -
 42
42 -
 43
43 -
 44
44 -
 45
45 -
 46
46 -
47
-
48
-
49
-
50
-
51
-
52
-
53
-
54
-
55
-
56
-
57
-
58
-
59
-
60
-
61
-
62
-
63
-
64
-
65
-
66
-
67
-
68
-
69
-
70
-
71
-
72
-
73
-
74
-
75
-
76
-
77
-
78
-
79
-
80
-
81
-
82
-
83
-
84
-
85
-
86
-
87
-
88
-
89
-
90
-
91
-
92
-
93
-
94
-
95
-
96
-
97
-
98
-
99
-
100
-
101
-
102
-
103
-
104
-
105
-
106
-
107
-
108
-
109
-
110
-
111
-
112
-
113
-
114
-
115
-
116
-
117
-
118
-
119
-
120
-
121
-
122
-
123
-
124
-
125
-
126
-
127
-
128
-
129
-
130
-
131
-
132
-
133
-
134
-
135
-
136
-
137
-
138
-
139
-
140
-
141
-
142
-
143
-
144
-
145
-
146
-
147
-
148
-
149
-
150
-
151
-
152
-
153
-
154
-
155
-
156
-
157
-
158
-
159
-
160
-
161
-
162
-
163
-
164
-
165
-
166
-
167
-
168
-
169
-
170
-
171
-
172
-
173
-
174
-
175
-
176
-
177
-
178
-
179
-
180
-
181
-
182
-
183
-
184
-
185
-
186
-
187
-
188
-
189
-
190
-
191
-
192
-
193
-
194
-
195
-
196
-
197
-
198
-
199
-
200
-
201
-
202
-
203
-
204
-
205
-
206
-
207
-
208
-
209
-
210
-
211
-
212
-
213
-
214
-
215
-
216
-
217
-
218
-
219
-
220
-
221
-
222
-
223
-
224
-
225
-
226
-
227
-
228
-
229
-
230
-
231
-
232
-
233
-
234
-
235
-
236
-
237
-
238
-
239
-
240
-
241
-
242
-
243
-
244
-
245
-
246
-
247
-
248
-
249
-
250
-
251
-
252
-
253
-
254
-
255
-
256
-
257
-
258
-
259
-
260
-
261
-
262
-
263
-
264
-
265
-
266
-
267
-
268
-
269
-
270
-
271
-
272
-
273
-
274
-
275
-
276
-
277
-
278
-
279
-
280
-
281
-
282
-
283
-
284
-
285
-
286
-
287
-
288
-
289
-
290
-
291
-
292
-
293
-
294
-
295
-
296
-
297
-
298
-
299
-
300
-
301
-
302
-
303
-
304
-
305
-
306
-
307
-
308
-
309
-
310
-
311
-
312
-
313
-
314
-
315
-
316
-
317
-
318
-
319
-
320
-
321
-
322
-
323
-
324
-
325
-
326
-
327
-
328
-
329
-
330
-
331
-
332
-
333
-
334
-
335
-
336
-
337
-
338
-
339
-
340
-
341
-
342
-
343
-
344
-
345
-
346
-
347
-
348
-
349
-
350
-
351
-
352
-
353
-
354
-
355
-
356
-
357
-
358
-
359
-
360
-
361
-
362
-
363
-
364
-
365
-
366
-
367
-
368
-
369
-
370
-
371
-
372
-
373
-
374
-
375
-
376
-
377
-
378
-
379
-
380
-
381
-
382
-
383
-
384
-
385
-
386
-
387
-
388
-
389
-
390
-
391
-
392
-
393
-
394
-
395
-
396
-
397
-
398
-
399
-
400
-
401
-
402
-
403
-
404
-
405
-
406
-
407
-
408
-
409
-
410
-
411
-
412
-
413
-
414
-
415
-
416
-
417
-
418
-
419
-
420
-
421
-
422
-
423
-
424
-
425
-
426
-
427
-
428
-
429
-
430
-
431
-
432
-
433
-
434
-
435
-
436
-
437
-
438
-
439
-
440
-
441
-
442
-
443
-
444
-
445
-
446
-
447
-
448
-
449
-
450
-
451
-
452
-
453
-
454
-
455
-
456
-
457
-
458
-
459
-
460
-
461
-
462
-
463
-
464
-
465
-
466
-
467
-
468
-
469
-
470
-
471
-
472
-
473
-
474
-
475
-
476
-
477
-
478
-
479
-
480
-
481
-
482
-
483
-
484
-
485
-
486
-
487
-
488
-
489
-
490
-
491
-
492
-
493
-
494
-
495
-
496
-
497
-
498
-
499
-
500
-
501
-
502
-
503
-
504
-
505
-
506
-
507
-
508
-
509
-
510
-
511
-
512
-
513
-
514
-
515
-
516
-
517
-
518
-
519
-
520
-
521
-
522
-
523
-
524
-
525
-
526
-
527
-
528
-
529
-
530
-
531
-
532
-
533
-
534
-
535
-
536
-
537
-
538
-
539
-
540
-
541
-
542
-
543
-
544
-
545
-
546
-
547
-
548
-
549
-
550
-
551
-
552
-
553
-
554
-
555
-
556
-
557
-
558
-
559
-
560
-
561
-
562
-
563
-
564
-
565
-
566
-
567
-
568
-
569
-
570
-
571
-
572
-
573
-
574
-
575
-
576
-
577
-
578
-
579
-
580
-
581
-
582
-
583
-
584
-
585
-
586
-
587
-
588
-
589
-
590
-
591
-
592
-
593
-
594
-
595
-
596
-
597
-
598
-
599
-
600
-
601
-
602
-
603
-
604
-
605
-
606
-
607
-
608
-
609
-
610
-
611
-
612
-
613
-
614
-
615
-
616
-
617
-
618
-
619
-
620
-
621
-
622
-
623
-
624
-
625
-
626
-
627
-
628
-
629
-
630
-
631
-
632
-
633
-
634
-
635
-
636
-
637
-
638
-
639
-
640
-
641
-
642
-
643
-
644
-
645
-
646
-
647
-
648
-
649
-
650
-
651
-
652
-
653
-
654
-
655
-
656
-
657
-
658
-
659
-
660
-
661
-
662
-
663
-
664
-
665
-
666
-
667
-
668
-
669
-
670
-
671
-
672
-
673
-
674
-
675
-
676
-
677
-
678
-
679
-
680
-
681
-
682
-
683
-
684
-
685
-
686
-
687
-
688
-
689
-
690
-
691
-
692
-
693
-
694
-
695
-
696
-
697
-
698
-
699
-
700
-
701
-
702
-
703
-
704
-
705
-
706
 |
 |

Table of Contents
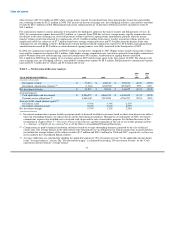
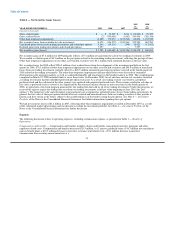
Table 4 — Net Securities Gains (Losses)
2009 2008
vs. vs.
YEAR ENDED DECEMBER 31, 2009 2008 2007 2008 2007
(Amounts in thousands)
Gross realized gains $ — $ 34,200 $ 5,611 $ (34,200) $ 28,589
Gross realized losses (2) (290,498) (1,962) 290,496 (288,536)
Other-than-temporary impairments (4,069) (70,274) (1,193,210) 66,204 1,122,936
Net securities losses from available-for-sale investments (4,071) (326,572) (1,189,561) 322,500 862,989
Unrealized gains (losses) from trading investments and related put options 4,304 (14,116) (195) 18,421 (13,921)
Realized gains from trading investments and related put options 7,557 — — 7,557 —
Net securities gains (losses) $ 7,790 $ (340,688) $ (1,189,756) $348,478 $ 849,068
Net securities gains of $7.8 million for 2009 primarily reflects a $7.6 million net gain from the call of two trading investments in 2009.
We recorded a valuation gain of $4.3 million on the put option related to the remaining trading investment, reflecting the passage of time.
Other-than-temporary impairments on our other asset-backed securities were $4.1 million from continued declines in the fair value.
Net securities losses for 2008 reflect $256.3 million of net realized losses from the realignment of the investment portfolio in the first
quarter of 2008, $70.3 million of other-than-temporary impairments on our other asset-backed securities and $40.6 million of unrealized
losses from our trading investments, partially offset by a $26.5 million unrealized gain from put options received in the fourth quarter of
2008 related to the trading investments. The other-than-temporary impairments and unrealized losses were the result of continued
deterioration in the mortgage markets, as well as continued illiquidity and uncertainty in the broader markets in 2008. The recapitalization
completed on March 25, 2008 included funds to cover these losses. In December 2008, two of our three auction rate securities classified
as trading investments had the embedded preferred put option exercised. As a result, one trading security converted to a perpetual
preferred stock and the collateral of the other security was replaced with perpetual preferred stock. These actions resulted in a decline in
fair value as preferred stock is viewed as less liquid and the discretionary income streams as more uncertain. In the fourth quarter of
2008, we opted into a buy-back program sponsored by the trading firm that sold us all of our trading investments. Under this program, we
received the right to require the trading firm to redeem our trading investments at full par value beginning in June 2010 (the "put
options"). The initial fair value and subsequent remeasurements are recognized as unrealized gains (losses) from trading investments. In
general, the fair value of these put options should offset any realized and unrealized losses from our trading securities as they provide a
known cash flow stream in the future, subject to the creditworthiness of the broker issuing the put options. See Note 6 — Investment
Portfolio of the Notes to the Consolidated Financial Statements for further information regarding these put options.
We had net securities losses of $1.2 billion in 2007, reflecting other-than-temporary impairments recorded in December 2007 as a result
of the substantial market deterioration and our decision to realign the investment portfolio. See Note 6 — Investment Portfolio of the
Notes to the Consolidated Financial Statements for further discussion.
Expenses
The following discussion relates to operating expenses, excluding commissions expense, as presented in Table 1 — Results of
Operations.
Compensation and benefits — Compensation and benefits includes salaries and benefits, management incentive programs and other
employee related costs. Compensation and benefits decreased $25.5 million, or 11 percent, primarily from a $14.3 million net curtailment
gain on benefit plans, a $12.3 million decrease in executive severance and related costs, a $7.1 million decrease in incentive
compensation from accruing annual incentives at a
33