MoneyGram 2009 Annual Report Download - page 38
Download and view the complete annual report
Please find page 38 of the 2009 MoneyGram annual report below. You can navigate through the pages in the report by either clicking on the pages listed below, or by using the keyword search tool below to find specific information within the annual report.-
 1
1 -
2
-
3
-
4
-
5
-
6
-
7
-
8
-
9
-
10
-
11
-
12
-
13
-
14
-
15
-
16
-
17
-
18
-
19
-
20
-
21
-
22
-
23
-
24
-
25
-
26
-
27
-
 28
28 -
 29
29 -
 30
30 -
 31
31 -
 32
32 -
 33
33 -
 34
34 -
 35
35 -
 36
36 -
 37
37 -
 38
38 -
 39
39 -
 40
40 -
 41
41 -
 42
42 -
 43
43 -
 44
44 -
 45
45 -
 46
46 -
 47
47 -
 48
48 -
49
-
50
-
51
-
52
-
53
-
54
-
55
-
56
-
57
-
58
-
59
-
60
-
61
-
62
-
63
-
64
-
65
-
66
-
67
-
68
-
69
-
70
-
71
-
72
-
73
-
74
-
75
-
76
-
77
-
78
-
79
-
80
-
81
-
82
-
83
-
84
-
85
-
86
-
87
-
88
-
89
-
90
-
91
-
92
-
93
-
94
-
95
-
96
-
97
-
98
-
99
-
100
-
101
-
102
-
103
-
104
-
105
-
106
-
107
-
108
-
109
-
110
-
111
-
112
-
113
-
114
-
115
-
116
-
117
-
118
-
119
-
120
-
121
-
122
-
123
-
124
-
125
-
126
-
127
-
128
-
129
-
130
-
131
-
132
-
133
-
134
-
135
-
136
-
137
-
138
-
139
-
140
-
141
-
142
-
143
-
144
-
145
-
146
-
147
-
148
-
149
-
150
-
151
-
152
-
153
-
154
-
155
-
156
-
157
-
158
-
159
-
160
-
161
-
162
-
163
-
164
-
165
-
166
-
167
-
168
-
169
-
170
-
171
-
172
-
173
-
174
-
175
-
176
-
177
-
178
-
179
-
180
-
181
-
182
-
183
-
184
-
185
-
186
-
187
-
188
-
189
-
190
-
191
-
192
-
193
-
194
-
195
-
196
-
197
-
198
-
199
-
200
-
201
-
202
-
203
-
204
-
205
-
206
-
207
-
208
-
209
-
210
-
211
-
212
-
213
-
214
-
215
-
216
-
217
-
218
-
219
-
220
-
221
-
222
-
223
-
224
-
225
-
226
-
227
-
228
-
229
-
230
-
231
-
232
-
233
-
234
-
235
-
236
-
237
-
238
-
239
-
240
-
241
-
242
-
243
-
244
-
245
-
246
-
247
-
248
-
249
-
250
-
251
-
252
-
253
-
254
-
255
-
256
-
257
-
258
-
259
-
260
-
261
-
262
-
263
-
264
-
265
-
266
-
267
-
268
-
269
-
270
-
271
-
272
-
273
-
274
-
275
-
276
-
277
-
278
-
279
-
280
-
281
-
282
-
283
-
284
-
285
-
286
-
287
-
288
-
289
-
290
-
291
-
292
-
293
-
294
-
295
-
296
-
297
-
298
-
299
-
300
-
301
-
302
-
303
-
304
-
305
-
306
-
307
-
308
-
309
-
310
-
311
-
312
-
313
-
314
-
315
-
316
-
317
-
318
-
319
-
320
-
321
-
322
-
323
-
324
-
325
-
326
-
327
-
328
-
329
-
330
-
331
-
332
-
333
-
334
-
335
-
336
-
337
-
338
-
339
-
340
-
341
-
342
-
343
-
344
-
345
-
346
-
347
-
348
-
349
-
350
-
351
-
352
-
353
-
354
-
355
-
356
-
357
-
358
-
359
-
360
-
361
-
362
-
363
-
364
-
365
-
366
-
367
-
368
-
369
-
370
-
371
-
372
-
373
-
374
-
375
-
376
-
377
-
378
-
379
-
380
-
381
-
382
-
383
-
384
-
385
-
386
-
387
-
388
-
389
-
390
-
391
-
392
-
393
-
394
-
395
-
396
-
397
-
398
-
399
-
400
-
401
-
402
-
403
-
404
-
405
-
406
-
407
-
408
-
409
-
410
-
411
-
412
-
413
-
414
-
415
-
416
-
417
-
418
-
419
-
420
-
421
-
422
-
423
-
424
-
425
-
426
-
427
-
428
-
429
-
430
-
431
-
432
-
433
-
434
-
435
-
436
-
437
-
438
-
439
-
440
-
441
-
442
-
443
-
444
-
445
-
446
-
447
-
448
-
449
-
450
-
451
-
452
-
453
-
454
-
455
-
456
-
457
-
458
-
459
-
460
-
461
-
462
-
463
-
464
-
465
-
466
-
467
-
468
-
469
-
470
-
471
-
472
-
473
-
474
-
475
-
476
-
477
-
478
-
479
-
480
-
481
-
482
-
483
-
484
-
485
-
486
-
487
-
488
-
489
-
490
-
491
-
492
-
493
-
494
-
495
-
496
-
497
-
498
-
499
-
500
-
501
-
502
-
503
-
504
-
505
-
506
-
507
-
508
-
509
-
510
-
511
-
512
-
513
-
514
-
515
-
516
-
517
-
518
-
519
-
520
-
521
-
522
-
523
-
524
-
525
-
526
-
527
-
528
-
529
-
530
-
531
-
532
-
533
-
534
-
535
-
536
-
537
-
538
-
539
-
540
-
541
-
542
-
543
-
544
-
545
-
546
-
547
-
548
-
549
-
550
-
551
-
552
-
553
-
554
-
555
-
556
-
557
-
558
-
559
-
560
-
561
-
562
-
563
-
564
-
565
-
566
-
567
-
568
-
569
-
570
-
571
-
572
-
573
-
574
-
575
-
576
-
577
-
578
-
579
-
580
-
581
-
582
-
583
-
584
-
585
-
586
-
587
-
588
-
589
-
590
-
591
-
592
-
593
-
594
-
595
-
596
-
597
-
598
-
599
-
600
-
601
-
602
-
603
-
604
-
605
-
606
-
607
-
608
-
609
-
610
-
611
-
612
-
613
-
614
-
615
-
616
-
617
-
618
-
619
-
620
-
621
-
622
-
623
-
624
-
625
-
626
-
627
-
628
-
629
-
630
-
631
-
632
-
633
-
634
-
635
-
636
-
637
-
638
-
639
-
640
-
641
-
642
-
643
-
644
-
645
-
646
-
647
-
648
-
649
-
650
-
651
-
652
-
653
-
654
-
655
-
656
-
657
-
658
-
659
-
660
-
661
-
662
-
663
-
664
-
665
-
666
-
667
-
668
-
669
-
670
-
671
-
672
-
673
-
674
-
675
-
676
-
677
-
678
-
679
-
680
-
681
-
682
-
683
-
684
-
685
-
686
-
687
-
688
-
689
-
690
-
691
-
692
-
693
-
694
-
695
-
696
-
697
-
698
-
699
-
700
-
701
-
702
-
703
-
704
-
705
-
706
 |
 |

Table of Contents
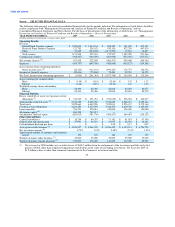
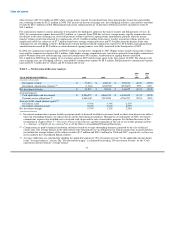
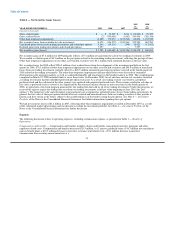
Occupancy, equipment and supplies expense increased $1.3 million, or 3 percent, in 2008 compared to 2007 from higher rent, software
maintenance and building operating costs, partially offset by lower freight and supplies expense. Office rent increased $1.3 million in
2008 due to the expansion of our retail locations and normal annual increases under our lease agreements. Software maintenance expense
increased $0.9 million in 2008 primarily from purchased licenses to support our growth. Additionally, disposal of fixed assets, building
operating costs, maintenance and higher property taxes increased our expenses by $1.6 million. Partially offsetting these increases is a
$2.2 million decline in freight and supplies expense due to lower shipments from the timing of the roll out of new agents.
Interest expense — Interest expense increased to $107.9 million in 2009 from $95.0 million in 2008 due to higher average outstanding
debt as a result of the recapitalization completed in the first quarter of 2008, partially offset by the repayment of $186.9 million of debt in
2009. In addition, interest expense in 2009 includes $2.7 million of expense from the write-off of a pro-rata portion of deferred financing
costs and unamortized discount on Tranche B of our Senior Facility in connection with the repayment of debt in December 2009. Based
on our outstanding debt balances and interest rates in effect at December 31, 2009 and the expectation that we will continue to pay all
interest in cash, our interest expense will be approximately $87.0 million in 2010. This amount would be reduced by any prepayments of
debt we may make in 2010.
Interest expense increased to $95.0 million in 2008 from $11.1 million in 2007 due to higher average outstanding debt resulting from the
recapitalization, amortization of additional deferred financing costs related to the new debt, amortization of the debt discount on the
Senior Facility and a $2.0 million net loss from the termination of interest rate swaps relating to our floating rate debt in the second
quarter of 2008. Interest expense on our variable rate Senior Facility benefited from the declining interest rate environment.
Depreciation and amortization — Depreciation and amortization expense includes depreciation on point of sale equipment, agent
signage, computer hardware and software, capitalized software development costs, office furniture, equipment and leasehold
improvements and amortization of intangible assets. Depreciation and amortization was flat in 2009 compared to 2008 as a $3.2 million
increase in depreciation from capital investments in point of sale equipment, purchased software and other fixed assets to support the
growth of the business was mostly offset by a $2.8 million decrease in amortization of capitalized software, intangible assets and other
assets. As reflected in each of the amounts discussed above, the change in the euro exchange rate, net of hedging activities, decreased
depreciation and amortization expense by approximately $0.6 million in 2009.
Depreciation and amortization increased $4.7 million, or 9 percent, in 2008 compared to 2007. Our investment in agent equipment and
signage, in connection with network growth, increased depreciation expense by $3.3 million, while our investment in computer hardware
and capitalized software to enhance our support functions increased depreciation expense by $0.3 million. Amortization of leasehold
improvements increased by $0.9 million primarily from build-outs at our main offices to support headcount additions and update aging
facilities. As reflected in each of the amounts discussed above, the change in the euro exchange rate, increased depreciation and
amortization by approximately $0.7 million in 2008.
We are developing a new system to provide improved connections between our agents and our marketing, sales, customer service and
support functions. The new system and associated processes are intended to increase the flexibility of our back office and improve
operating efficiencies. In 2009 and 2008, we capitalized software costs of approximately $2.9 million and $3.8 million, respectively,
related to this project that will impact future depreciation and amortization.
Income taxes — We had a tax benefit of $20.4 million in 2009, primarily reflecting a release of $17.6 million of valuation allowances on
realized deferred tax assets. Our pre-tax net loss of $22.3 million, when adjusted for our estimated book to tax differences, results in
taxable income, allowing us to release some valuation allowances on our tax loss carryovers. The book to tax differences included
impairments on securities and other assets, as well as accruals related to separated employees, litigation and unrealized foreign exchange
losses.
In 2008, we had a $75.8 million tax benefit, primarily reflecting the recognition of a $90.5 million benefit in the fourth quarter of 2008
upon the completion of an evaluation of the technical merits of tax positions with respect to part of the net securities losses in 2008 and
2007. The $90.5 million benefit relates to the amount of tax carry-back we were able to utilize to recover tax payments made for fiscal
2005 through 2007. We had tax expense of
35