MoneyGram 2009 Annual Report Download - page 43
Download and view the complete annual report
Please find page 43 of the 2009 MoneyGram annual report below. You can navigate through the pages in the report by either clicking on the pages listed below, or by using the keyword search tool below to find specific information within the annual report.-
 1
1 -
2
-
3
-
4
-
5
-
6
-
7
-
8
-
9
-
10
-
11
-
12
-
13
-
14
-
15
-
16
-
17
-
18
-
19
-
20
-
21
-
22
-
23
-
24
-
25
-
26
-
27
-
28
-
29
-
30
-
31
-
32
-
 33
33 -
 34
34 -
 35
35 -
 36
36 -
 37
37 -
 38
38 -
 39
39 -
 40
40 -
 41
41 -
 42
42 -
 43
43 -
 44
44 -
 45
45 -
 46
46 -
 47
47 -
 48
48 -
 49
49 -
 50
50 -
 51
51 -
 52
52 -
 53
53 -
54
-
55
-
56
-
57
-
58
-
59
-
60
-
61
-
62
-
63
-
64
-
65
-
66
-
67
-
68
-
69
-
70
-
71
-
72
-
73
-
74
-
75
-
76
-
77
-
78
-
79
-
80
-
81
-
82
-
83
-
84
-
85
-
86
-
87
-
88
-
89
-
90
-
91
-
92
-
93
-
94
-
95
-
96
-
97
-
98
-
99
-
100
-
101
-
102
-
103
-
104
-
105
-
106
-
107
-
108
-
109
-
110
-
111
-
112
-
113
-
114
-
115
-
116
-
117
-
118
-
119
-
120
-
121
-
122
-
123
-
124
-
125
-
126
-
127
-
128
-
129
-
130
-
131
-
132
-
133
-
134
-
135
-
136
-
137
-
138
-
139
-
140
-
141
-
142
-
143
-
144
-
145
-
146
-
147
-
148
-
149
-
150
-
151
-
152
-
153
-
154
-
155
-
156
-
157
-
158
-
159
-
160
-
161
-
162
-
163
-
164
-
165
-
166
-
167
-
168
-
169
-
170
-
171
-
172
-
173
-
174
-
175
-
176
-
177
-
178
-
179
-
180
-
181
-
182
-
183
-
184
-
185
-
186
-
187
-
188
-
189
-
190
-
191
-
192
-
193
-
194
-
195
-
196
-
197
-
198
-
199
-
200
-
201
-
202
-
203
-
204
-
205
-
206
-
207
-
208
-
209
-
210
-
211
-
212
-
213
-
214
-
215
-
216
-
217
-
218
-
219
-
220
-
221
-
222
-
223
-
224
-
225
-
226
-
227
-
228
-
229
-
230
-
231
-
232
-
233
-
234
-
235
-
236
-
237
-
238
-
239
-
240
-
241
-
242
-
243
-
244
-
245
-
246
-
247
-
248
-
249
-
250
-
251
-
252
-
253
-
254
-
255
-
256
-
257
-
258
-
259
-
260
-
261
-
262
-
263
-
264
-
265
-
266
-
267
-
268
-
269
-
270
-
271
-
272
-
273
-
274
-
275
-
276
-
277
-
278
-
279
-
280
-
281
-
282
-
283
-
284
-
285
-
286
-
287
-
288
-
289
-
290
-
291
-
292
-
293
-
294
-
295
-
296
-
297
-
298
-
299
-
300
-
301
-
302
-
303
-
304
-
305
-
306
-
307
-
308
-
309
-
310
-
311
-
312
-
313
-
314
-
315
-
316
-
317
-
318
-
319
-
320
-
321
-
322
-
323
-
324
-
325
-
326
-
327
-
328
-
329
-
330
-
331
-
332
-
333
-
334
-
335
-
336
-
337
-
338
-
339
-
340
-
341
-
342
-
343
-
344
-
345
-
346
-
347
-
348
-
349
-
350
-
351
-
352
-
353
-
354
-
355
-
356
-
357
-
358
-
359
-
360
-
361
-
362
-
363
-
364
-
365
-
366
-
367
-
368
-
369
-
370
-
371
-
372
-
373
-
374
-
375
-
376
-
377
-
378
-
379
-
380
-
381
-
382
-
383
-
384
-
385
-
386
-
387
-
388
-
389
-
390
-
391
-
392
-
393
-
394
-
395
-
396
-
397
-
398
-
399
-
400
-
401
-
402
-
403
-
404
-
405
-
406
-
407
-
408
-
409
-
410
-
411
-
412
-
413
-
414
-
415
-
416
-
417
-
418
-
419
-
420
-
421
-
422
-
423
-
424
-
425
-
426
-
427
-
428
-
429
-
430
-
431
-
432
-
433
-
434
-
435
-
436
-
437
-
438
-
439
-
440
-
441
-
442
-
443
-
444
-
445
-
446
-
447
-
448
-
449
-
450
-
451
-
452
-
453
-
454
-
455
-
456
-
457
-
458
-
459
-
460
-
461
-
462
-
463
-
464
-
465
-
466
-
467
-
468
-
469
-
470
-
471
-
472
-
473
-
474
-
475
-
476
-
477
-
478
-
479
-
480
-
481
-
482
-
483
-
484
-
485
-
486
-
487
-
488
-
489
-
490
-
491
-
492
-
493
-
494
-
495
-
496
-
497
-
498
-
499
-
500
-
501
-
502
-
503
-
504
-
505
-
506
-
507
-
508
-
509
-
510
-
511
-
512
-
513
-
514
-
515
-
516
-
517
-
518
-
519
-
520
-
521
-
522
-
523
-
524
-
525
-
526
-
527
-
528
-
529
-
530
-
531
-
532
-
533
-
534
-
535
-
536
-
537
-
538
-
539
-
540
-
541
-
542
-
543
-
544
-
545
-
546
-
547
-
548
-
549
-
550
-
551
-
552
-
553
-
554
-
555
-
556
-
557
-
558
-
559
-
560
-
561
-
562
-
563
-
564
-
565
-
566
-
567
-
568
-
569
-
570
-
571
-
572
-
573
-
574
-
575
-
576
-
577
-
578
-
579
-
580
-
581
-
582
-
583
-
584
-
585
-
586
-
587
-
588
-
589
-
590
-
591
-
592
-
593
-
594
-
595
-
596
-
597
-
598
-
599
-
600
-
601
-
602
-
603
-
604
-
605
-
606
-
607
-
608
-
609
-
610
-
611
-
612
-
613
-
614
-
615
-
616
-
617
-
618
-
619
-
620
-
621
-
622
-
623
-
624
-
625
-
626
-
627
-
628
-
629
-
630
-
631
-
632
-
633
-
634
-
635
-
636
-
637
-
638
-
639
-
640
-
641
-
642
-
643
-
644
-
645
-
646
-
647
-
648
-
649
-
650
-
651
-
652
-
653
-
654
-
655
-
656
-
657
-
658
-
659
-
660
-
661
-
662
-
663
-
664
-
665
-
666
-
667
-
668
-
669
-
670
-
671
-
672
-
673
-
674
-
675
-
676
-
677
-
678
-
679
-
680
-
681
-
682
-
683
-
684
-
685
-
686
-
687
-
688
-
689
-
690
-
691
-
692
-
693
-
694
-
695
-
696
-
697
-
698
-
699
-
700
-
701
-
702
-
703
-
704
-
705
-
706
 |
 |

Table of Contents
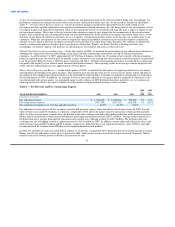
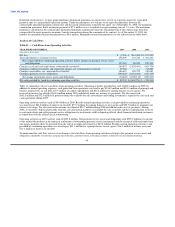
Table 7 — Financial Paper Products Segment
2009 2008
vs. vs.
YEAR ENDED DECEMBER 31, 2009 2008 2007 2008 2007
(Amounts in thousands)
Money order revenue:
Fee and other revenue $ 69,296 $ 59,954 $ 62,520 16% (4)%
Investment revenue 5,584 26,357 92,871 (79)% (72)%
Total money order revenue 74,880 86,311 155,391 (13)% (44)%
Official check revenue:
Fee and other revenue 23,690 18,061 15,055 31% 20%
Investment revenue 24,213 133,820 299,680 (82)% (55)%
Total official check and payment processing revenue 47,903 151,881 314,735 (68)% (52)%
Total Financial Paper Products revenue:
Fee and other revenue 92,986 78,015 77,575 19% 1%
Investment revenue 29,797 160,177 392,551 (81)% (59)%
Total Financial Paper Products revenue 122,783 238,192 470,126 (48)% (49)%
Commissions expense (8,295) (110,310) (262,684) 92% 58%
Net revenue $ 114,488 $ 127,882 $ 207,442 (10)% (38)%
Operating income $ 27,372 $ 30,169 $ 93,283 (9)% (68)%
Operating margin 22.3% 12.7% 19.8%
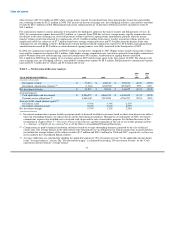
2009 Compared to 2008
Total revenue for the Financial Paper Products segment consists of investment revenue and per-item fees charged to our financial
institution customers and retail agents. For 2009, Financial Paper Products total revenue decreased $115.4 million, or 48 percent, due
primarily to a $130.4 million, or 81 percent, decrease in investment revenue from lower yields earned on our investment portfolio and a
decline in average investable balances from the termination of certain official check financial customers. See Table 3 — Net Investment
Revenue Analysis for further information. This decrease was partially offset by a $15.0 million increase in fee and other revenue for
money order and official check products, primarily due to our repricing initiatives. Beginning in the fourth quarter of 2008, we
implemented a phased repricing initiative for money order, which includes remittance schedule changes focused on reducing our credit
exposure and had an emphasis on agents that sell only our money order product. During 2009, money order volumes declined 17 percent.
This decline is attributed to the anticipated attrition of agents due to the repricing initiative, consumer pricing increases as agents pass
along fee increases, the continued migration to other payment methods and the general economic environment.
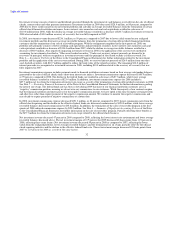
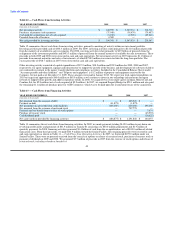
Commissions expense includes payments made to financial institution customers based on official check and money order average
investable balance times short-term interest rate indices. Commissions expense decreased $102.0 million, or 92 percent, from 2008.
Commissions expense for 2008 included a $27.7 million net loss due to the termination of interest rate swaps related to the official check
business. See Note 7 — Derivative Financial Instruments of the Notes to Consolidated Financial Statements for further information.
Investment commissions paid to financial institution customers decreased in 2009 from the decline in the federal funds rate and lower
investment balances upon which commissions were paid. See Table 3 — Net Investment Revenue Analysis for further information.
Operating margin increased to 22.3 percent in 2009 from 12.7 percent in 2008, reflecting the growth in fee revenue from repricing
initiatives, the $27.7 million loss from the termination of swaps in 2008 and lower commissions expense from the decline in the federal
funds rate and lower investment balances.
40