MoneyGram 2009 Annual Report Download - page 34
Download and view the complete annual report
Please find page 34 of the 2009 MoneyGram annual report below. You can navigate through the pages in the report by either clicking on the pages listed below, or by using the keyword search tool below to find specific information within the annual report.-
 1
1 -
2
-
3
-
4
-
5
-
6
-
7
-
8
-
9
-
10
-
11
-
12
-
13
-
14
-
15
-
16
-
17
-
18
-
19
-
20
-
21
-
22
-
23
-
 24
24 -
 25
25 -
 26
26 -
 27
27 -
 28
28 -
 29
29 -
 30
30 -
 31
31 -
 32
32 -
 33
33 -
 34
34 -
 35
35 -
 36
36 -
 37
37 -
 38
38 -
 39
39 -
 40
40 -
 41
41 -
 42
42 -
 43
43 -
 44
44 -
45
-
46
-
47
-
48
-
49
-
50
-
51
-
52
-
53
-
54
-
55
-
56
-
57
-
58
-
59
-
60
-
61
-
62
-
63
-
64
-
65
-
66
-
67
-
68
-
69
-
70
-
71
-
72
-
73
-
74
-
75
-
76
-
77
-
78
-
79
-
80
-
81
-
82
-
83
-
84
-
85
-
86
-
87
-
88
-
89
-
90
-
91
-
92
-
93
-
94
-
95
-
96
-
97
-
98
-
99
-
100
-
101
-
102
-
103
-
104
-
105
-
106
-
107
-
108
-
109
-
110
-
111
-
112
-
113
-
114
-
115
-
116
-
117
-
118
-
119
-
120
-
121
-
122
-
123
-
124
-
125
-
126
-
127
-
128
-
129
-
130
-
131
-
132
-
133
-
134
-
135
-
136
-
137
-
138
-
139
-
140
-
141
-
142
-
143
-
144
-
145
-
146
-
147
-
148
-
149
-
150
-
151
-
152
-
153
-
154
-
155
-
156
-
157
-
158
-
159
-
160
-
161
-
162
-
163
-
164
-
165
-
166
-
167
-
168
-
169
-
170
-
171
-
172
-
173
-
174
-
175
-
176
-
177
-
178
-
179
-
180
-
181
-
182
-
183
-
184
-
185
-
186
-
187
-
188
-
189
-
190
-
191
-
192
-
193
-
194
-
195
-
196
-
197
-
198
-
199
-
200
-
201
-
202
-
203
-
204
-
205
-
206
-
207
-
208
-
209
-
210
-
211
-
212
-
213
-
214
-
215
-
216
-
217
-
218
-
219
-
220
-
221
-
222
-
223
-
224
-
225
-
226
-
227
-
228
-
229
-
230
-
231
-
232
-
233
-
234
-
235
-
236
-
237
-
238
-
239
-
240
-
241
-
242
-
243
-
244
-
245
-
246
-
247
-
248
-
249
-
250
-
251
-
252
-
253
-
254
-
255
-
256
-
257
-
258
-
259
-
260
-
261
-
262
-
263
-
264
-
265
-
266
-
267
-
268
-
269
-
270
-
271
-
272
-
273
-
274
-
275
-
276
-
277
-
278
-
279
-
280
-
281
-
282
-
283
-
284
-
285
-
286
-
287
-
288
-
289
-
290
-
291
-
292
-
293
-
294
-
295
-
296
-
297
-
298
-
299
-
300
-
301
-
302
-
303
-
304
-
305
-
306
-
307
-
308
-
309
-
310
-
311
-
312
-
313
-
314
-
315
-
316
-
317
-
318
-
319
-
320
-
321
-
322
-
323
-
324
-
325
-
326
-
327
-
328
-
329
-
330
-
331
-
332
-
333
-
334
-
335
-
336
-
337
-
338
-
339
-
340
-
341
-
342
-
343
-
344
-
345
-
346
-
347
-
348
-
349
-
350
-
351
-
352
-
353
-
354
-
355
-
356
-
357
-
358
-
359
-
360
-
361
-
362
-
363
-
364
-
365
-
366
-
367
-
368
-
369
-
370
-
371
-
372
-
373
-
374
-
375
-
376
-
377
-
378
-
379
-
380
-
381
-
382
-
383
-
384
-
385
-
386
-
387
-
388
-
389
-
390
-
391
-
392
-
393
-
394
-
395
-
396
-
397
-
398
-
399
-
400
-
401
-
402
-
403
-
404
-
405
-
406
-
407
-
408
-
409
-
410
-
411
-
412
-
413
-
414
-
415
-
416
-
417
-
418
-
419
-
420
-
421
-
422
-
423
-
424
-
425
-
426
-
427
-
428
-
429
-
430
-
431
-
432
-
433
-
434
-
435
-
436
-
437
-
438
-
439
-
440
-
441
-
442
-
443
-
444
-
445
-
446
-
447
-
448
-
449
-
450
-
451
-
452
-
453
-
454
-
455
-
456
-
457
-
458
-
459
-
460
-
461
-
462
-
463
-
464
-
465
-
466
-
467
-
468
-
469
-
470
-
471
-
472
-
473
-
474
-
475
-
476
-
477
-
478
-
479
-
480
-
481
-
482
-
483
-
484
-
485
-
486
-
487
-
488
-
489
-
490
-
491
-
492
-
493
-
494
-
495
-
496
-
497
-
498
-
499
-
500
-
501
-
502
-
503
-
504
-
505
-
506
-
507
-
508
-
509
-
510
-
511
-
512
-
513
-
514
-
515
-
516
-
517
-
518
-
519
-
520
-
521
-
522
-
523
-
524
-
525
-
526
-
527
-
528
-
529
-
530
-
531
-
532
-
533
-
534
-
535
-
536
-
537
-
538
-
539
-
540
-
541
-
542
-
543
-
544
-
545
-
546
-
547
-
548
-
549
-
550
-
551
-
552
-
553
-
554
-
555
-
556
-
557
-
558
-
559
-
560
-
561
-
562
-
563
-
564
-
565
-
566
-
567
-
568
-
569
-
570
-
571
-
572
-
573
-
574
-
575
-
576
-
577
-
578
-
579
-
580
-
581
-
582
-
583
-
584
-
585
-
586
-
587
-
588
-
589
-
590
-
591
-
592
-
593
-
594
-
595
-
596
-
597
-
598
-
599
-
600
-
601
-
602
-
603
-
604
-
605
-
606
-
607
-
608
-
609
-
610
-
611
-
612
-
613
-
614
-
615
-
616
-
617
-
618
-
619
-
620
-
621
-
622
-
623
-
624
-
625
-
626
-
627
-
628
-
629
-
630
-
631
-
632
-
633
-
634
-
635
-
636
-
637
-
638
-
639
-
640
-
641
-
642
-
643
-
644
-
645
-
646
-
647
-
648
-
649
-
650
-
651
-
652
-
653
-
654
-
655
-
656
-
657
-
658
-
659
-
660
-
661
-
662
-
663
-
664
-
665
-
666
-
667
-
668
-
669
-
670
-
671
-
672
-
673
-
674
-
675
-
676
-
677
-
678
-
679
-
680
-
681
-
682
-
683
-
684
-
685
-
686
-
687
-
688
-
689
-
690
-
691
-
692
-
693
-
694
-
695
-
696
-
697
-
698
-
699
-
700
-
701
-
702
-
703
-
704
-
705
-
706
 |
 |
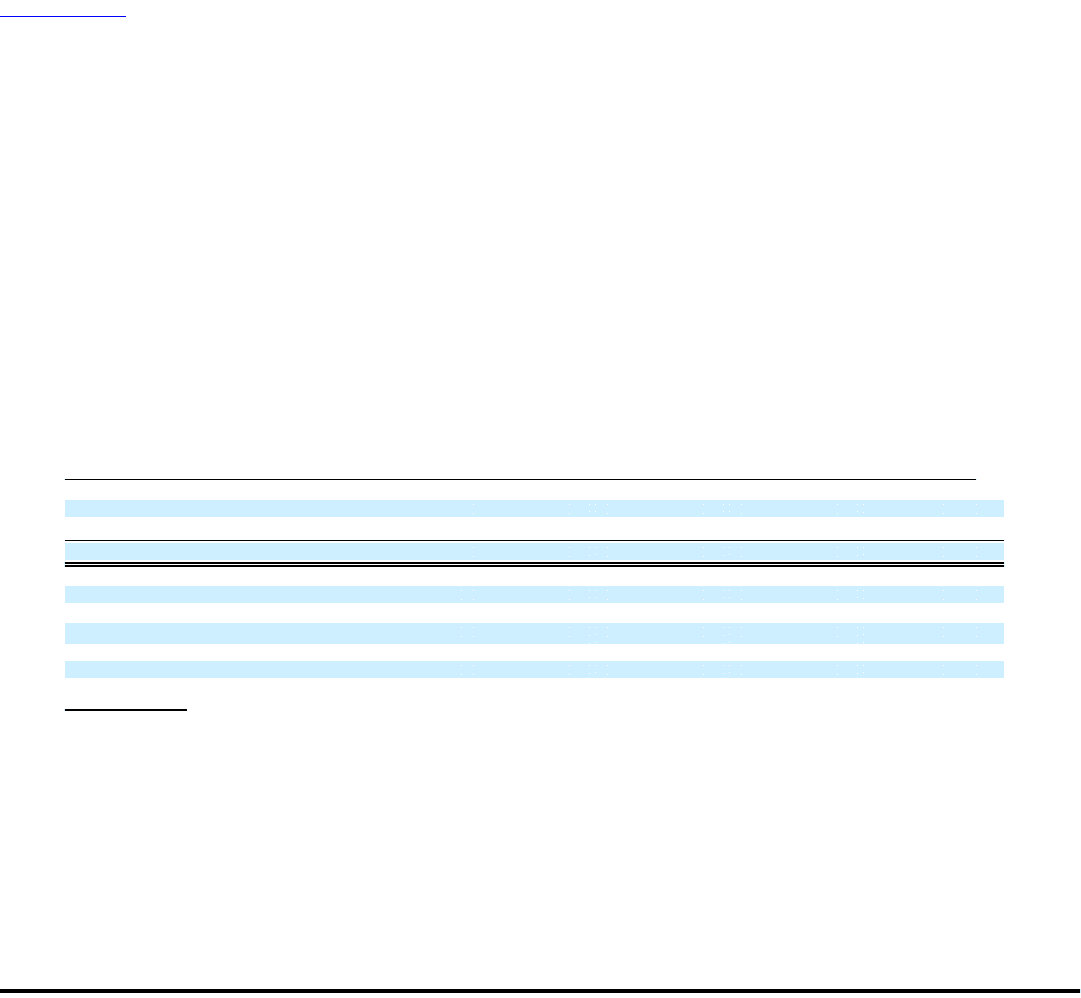
Table of Contents
other revenue of $131.8 million in 2008, while average money transfer fees declined from lower principal per transaction and corridor
mix, reducing revenue by $12.1 million in 2008. The increase in the euro exchange rate, net of hedging activities, increased fee and other
revenue by $20.7 million in 2008. Bill payment transaction volume growth of 13 percent in 2008 increased fee and other revenue by
$19.1 million.
Fee commissions expense consists primarily of fees paid to our third-party agents for the money transfer and bill payment services. In
2009, fee commissions expense decreased $5.2 million, or 1 percent, from 2008 due to lower average money transfer commission rates,
the decline in the euro exchange rate, lower bill payment volumes and lower signing bonus amortization, partially offset by money
transfer volume growth. Incremental fee commissions of $16.1 million resulting from money transfer transaction volume growth was
significantly offset by a decrease of $7.7 million from lower average commission rates and $7.6 million from the decline in the euro
exchange rate, net of hedging activities. Bill payment volume declines reduced commissions expense by $3.8 million and signing bonus
amortization decreased by $2.0 million as certain historical signing bonuses were fully amortized in the third quarter of 2009.
In 2008, fee commissions expense increased $92.0 million, or 22 percent, compared to 2007. Higher money transfer transaction volumes
increased fee commissions expense $54.4 million, while higher average commissions per transaction, primarily from higher commissions
paid to Walmart from new contract pricing, increased commissions $4.0 million. Amortization of signing bonuses increased
$11.4 million in 2008 from the signing of several large agents in 2007 and one large agent in the first quarter of 2008. The change in the
euro exchange rate, net of hedging activities, increased fee commissions expense by $8.8 million. Bill payment fee commissions expense
increased $11.3 million due to volume and $3.2 million due to rate.
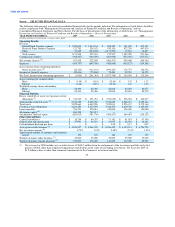
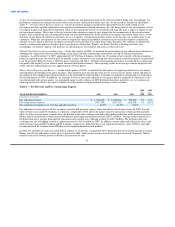
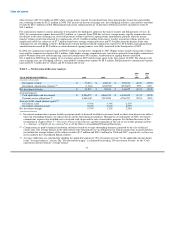
Table 3 — Net Investment Revenue Analysis
2009 2008
vs. vs.
YEAR ENDED DECEMBER 31, 2009 2008 2007 2008 2007
(Amounts in thousands)
Investment revenue $ 33,219 $ 162,130 $ 398,234 (80)% (59)%
Investment commissions expense (1) (1,362) (102,292) (253,607) 99% 60%
Net investment revenue $ 31,857 $ 59,838 $ 144,627 (47)% (59)%
Average balances:
Cash equivalents and investments $ 4,246,507 $ 4,866,339 $ 6,346,442 (13)% (23)%
Payment service obligations (2) 3,048,100 3,923,989 4,796,257 (22)% (18)%
Average yields earned and rates paid (3):
Investment yield 0.78% 3.33% 6.27%
Investment commission rate 0.04% 2.61% 5.29%
Net investment margin 0.75% 1.23% 2.28%
(1) Investment commissions expense includes payments made to financial institution customers based on short-term interest rate indices
times the outstanding balances of official checks sold by that financial institution. Through the second quarter of 2008, investment
commissions expense also included costs associated with swaps and the sale of receivables program. See further discussion of the
termination of swaps in Note 7 — Derivative Financial Instruments, and the termination of the sale of receivables program in Note
3 — Summary of Significant Accounting Policies of the Notes to Consolidated Financial Statements.
(2) Commissions are paid to financial institution customers based on average outstanding balances generated by the sale of official
checks only. The average balance in the table reflects only the payment service obligations for which commissions are paid and does
not include the average balance of the sold receivables ($3.7 million and $349.9 million for 2008 and 2007, respectively) as these are
not recorded in the Consolidated Balance Sheets.
(3) Average yields/rates are calculated by dividing the applicable amount of "Net investment revenue" by the applicable amount shown
in the "Average balances" section. The "Net investment margin" is calculated by dividing "Net investment revenue" by the "Cash
equivalents and investments" average balance.
31