MoneyGram 2009 Annual Report Download - page 39
Download and view the complete annual report
Please find page 39 of the 2009 MoneyGram annual report below. You can navigate through the pages in the report by either clicking on the pages listed below, or by using the keyword search tool below to find specific information within the annual report.-
 1
1 -
2
-
3
-
4
-
5
-
6
-
7
-
8
-
9
-
10
-
11
-
12
-
13
-
14
-
15
-
16
-
17
-
18
-
19
-
20
-
21
-
22
-
23
-
24
-
25
-
26
-
27
-
28
-
 29
29 -
 30
30 -
 31
31 -
 32
32 -
 33
33 -
 34
34 -
 35
35 -
 36
36 -
 37
37 -
 38
38 -
 39
39 -
 40
40 -
 41
41 -
 42
42 -
 43
43 -
 44
44 -
 45
45 -
 46
46 -
 47
47 -
 48
48 -
 49
49 -
50
-
51
-
52
-
53
-
54
-
55
-
56
-
57
-
58
-
59
-
60
-
61
-
62
-
63
-
64
-
65
-
66
-
67
-
68
-
69
-
70
-
71
-
72
-
73
-
74
-
75
-
76
-
77
-
78
-
79
-
80
-
81
-
82
-
83
-
84
-
85
-
86
-
87
-
88
-
89
-
90
-
91
-
92
-
93
-
94
-
95
-
96
-
97
-
98
-
99
-
100
-
101
-
102
-
103
-
104
-
105
-
106
-
107
-
108
-
109
-
110
-
111
-
112
-
113
-
114
-
115
-
116
-
117
-
118
-
119
-
120
-
121
-
122
-
123
-
124
-
125
-
126
-
127
-
128
-
129
-
130
-
131
-
132
-
133
-
134
-
135
-
136
-
137
-
138
-
139
-
140
-
141
-
142
-
143
-
144
-
145
-
146
-
147
-
148
-
149
-
150
-
151
-
152
-
153
-
154
-
155
-
156
-
157
-
158
-
159
-
160
-
161
-
162
-
163
-
164
-
165
-
166
-
167
-
168
-
169
-
170
-
171
-
172
-
173
-
174
-
175
-
176
-
177
-
178
-
179
-
180
-
181
-
182
-
183
-
184
-
185
-
186
-
187
-
188
-
189
-
190
-
191
-
192
-
193
-
194
-
195
-
196
-
197
-
198
-
199
-
200
-
201
-
202
-
203
-
204
-
205
-
206
-
207
-
208
-
209
-
210
-
211
-
212
-
213
-
214
-
215
-
216
-
217
-
218
-
219
-
220
-
221
-
222
-
223
-
224
-
225
-
226
-
227
-
228
-
229
-
230
-
231
-
232
-
233
-
234
-
235
-
236
-
237
-
238
-
239
-
240
-
241
-
242
-
243
-
244
-
245
-
246
-
247
-
248
-
249
-
250
-
251
-
252
-
253
-
254
-
255
-
256
-
257
-
258
-
259
-
260
-
261
-
262
-
263
-
264
-
265
-
266
-
267
-
268
-
269
-
270
-
271
-
272
-
273
-
274
-
275
-
276
-
277
-
278
-
279
-
280
-
281
-
282
-
283
-
284
-
285
-
286
-
287
-
288
-
289
-
290
-
291
-
292
-
293
-
294
-
295
-
296
-
297
-
298
-
299
-
300
-
301
-
302
-
303
-
304
-
305
-
306
-
307
-
308
-
309
-
310
-
311
-
312
-
313
-
314
-
315
-
316
-
317
-
318
-
319
-
320
-
321
-
322
-
323
-
324
-
325
-
326
-
327
-
328
-
329
-
330
-
331
-
332
-
333
-
334
-
335
-
336
-
337
-
338
-
339
-
340
-
341
-
342
-
343
-
344
-
345
-
346
-
347
-
348
-
349
-
350
-
351
-
352
-
353
-
354
-
355
-
356
-
357
-
358
-
359
-
360
-
361
-
362
-
363
-
364
-
365
-
366
-
367
-
368
-
369
-
370
-
371
-
372
-
373
-
374
-
375
-
376
-
377
-
378
-
379
-
380
-
381
-
382
-
383
-
384
-
385
-
386
-
387
-
388
-
389
-
390
-
391
-
392
-
393
-
394
-
395
-
396
-
397
-
398
-
399
-
400
-
401
-
402
-
403
-
404
-
405
-
406
-
407
-
408
-
409
-
410
-
411
-
412
-
413
-
414
-
415
-
416
-
417
-
418
-
419
-
420
-
421
-
422
-
423
-
424
-
425
-
426
-
427
-
428
-
429
-
430
-
431
-
432
-
433
-
434
-
435
-
436
-
437
-
438
-
439
-
440
-
441
-
442
-
443
-
444
-
445
-
446
-
447
-
448
-
449
-
450
-
451
-
452
-
453
-
454
-
455
-
456
-
457
-
458
-
459
-
460
-
461
-
462
-
463
-
464
-
465
-
466
-
467
-
468
-
469
-
470
-
471
-
472
-
473
-
474
-
475
-
476
-
477
-
478
-
479
-
480
-
481
-
482
-
483
-
484
-
485
-
486
-
487
-
488
-
489
-
490
-
491
-
492
-
493
-
494
-
495
-
496
-
497
-
498
-
499
-
500
-
501
-
502
-
503
-
504
-
505
-
506
-
507
-
508
-
509
-
510
-
511
-
512
-
513
-
514
-
515
-
516
-
517
-
518
-
519
-
520
-
521
-
522
-
523
-
524
-
525
-
526
-
527
-
528
-
529
-
530
-
531
-
532
-
533
-
534
-
535
-
536
-
537
-
538
-
539
-
540
-
541
-
542
-
543
-
544
-
545
-
546
-
547
-
548
-
549
-
550
-
551
-
552
-
553
-
554
-
555
-
556
-
557
-
558
-
559
-
560
-
561
-
562
-
563
-
564
-
565
-
566
-
567
-
568
-
569
-
570
-
571
-
572
-
573
-
574
-
575
-
576
-
577
-
578
-
579
-
580
-
581
-
582
-
583
-
584
-
585
-
586
-
587
-
588
-
589
-
590
-
591
-
592
-
593
-
594
-
595
-
596
-
597
-
598
-
599
-
600
-
601
-
602
-
603
-
604
-
605
-
606
-
607
-
608
-
609
-
610
-
611
-
612
-
613
-
614
-
615
-
616
-
617
-
618
-
619
-
620
-
621
-
622
-
623
-
624
-
625
-
626
-
627
-
628
-
629
-
630
-
631
-
632
-
633
-
634
-
635
-
636
-
637
-
638
-
639
-
640
-
641
-
642
-
643
-
644
-
645
-
646
-
647
-
648
-
649
-
650
-
651
-
652
-
653
-
654
-
655
-
656
-
657
-
658
-
659
-
660
-
661
-
662
-
663
-
664
-
665
-
666
-
667
-
668
-
669
-
670
-
671
-
672
-
673
-
674
-
675
-
676
-
677
-
678
-
679
-
680
-
681
-
682
-
683
-
684
-
685
-
686
-
687
-
688
-
689
-
690
-
691
-
692
-
693
-
694
-
695
-
696
-
697
-
698
-
699
-
700
-
701
-
702
-
703
-
704
-
705
-
706
 |
 |

Table of Contents
$78.5 million in 2007 on a pre-tax loss of $993.3 million, reflecting the tax treatment of the $1.2 billion of investment losses incurred in
2007.
In 2007, we determined it was appropriate to establish a valuation allowance for the deferred tax assets relating to the full basis difference
on our asset-backed securities. In 2008 and 2009, we continued to believe that it was appropriate to maintain a full valuation allowance
for the deferred tax assets related to the full basis difference on these securities and our tax attributes. Essentially all of our deferred tax
assets relate to the U.S. jurisdiction, where we are in a net deferred tax liability position, and we do not believe we have sufficient
positive evidence to overcome the negative evidence. Changes in facts and circumstances in the future may cause us to record additional
tax benefits as further deferred tax valuation allowances are released and carry-forwards are utilized. We continue to evaluate additional
available tax positions related to the net securities losses in prior years.
Segment Performance
Our reporting segments are primarily organized based on the nature of products and services offered and the type of consumer served.
During the fourth quarter of 2009, we revised our segment reporting to reflect changes in how we manage our business, review operating
performance and allocate resources. We now manage our business primarily through two reporting segments, Global Funds Transfer and
Financial Paper Products. The Global Funds Transfer segment provides global money transfers and bill payment services to consumers
through a network of agents and, in select markets, company-operated locations. The Financial Paper Products segment provides money
orders to consumers through our retail and financial institution locations in the United States and Puerto Rico, and provides official check
services to financial institutions in the United States. Businesses which are not operated within these segments are categorized as "Other,"
and primarily relate to discontinued products and businesses. Prior year results have been revised for comparative purposes.
The Global Funds Transfer segment is managed as two geographical regions, the Americas and EMEAAP, to coordinate sales, agent
management and marketing activities. The Americas region includes the United States, Canada, Mexico and Latin America (including the
Caribbean). The EMEAAP region includes Europe, the Middle East, Africa and the Asia Pacific region. We monitor performance and
allocate resources at both a regional and reporting segment level. As the two regions routinely interact in completing money transfer
transactions and share systems, processes and licenses, we view the Global Funds Transfer segment as one global network. The nature of
the consumers and products offered is the same for each region, and the regions utilize the same agent network, systems and support
functions. In addition, the regions have similar regulatory requirements and economic characteristics. Accordingly, we aggregate the two
regions into one reporting segment.
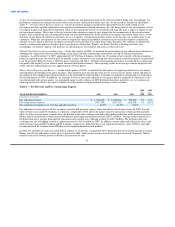
Segment accounting policies are the same as those described in Note 3 — Summary of Significant Accounting Policies in the Notes to the
Consolidated Financial Statements. We manage our investment portfolio on a consolidated level, with no specific investment security
assigned to a particular segment. However, investment revenue is allocated to each segment based on the average investable balances
generated by that segment's sale of payment instruments during the period. Net securities gains (losses) are not allocated to the segments
as the investment portfolio is managed at a consolidated level. While the derivatives portfolio is also managed on a consolidated level,
each derivative instrument is utilized in a manner that can be identified to a particular segment. Interest rate swaps historically used to
hedge variable rate commissions were identified with the official check product in the Financial Paper Products segment, while forward
foreign exchange contracts are identified with the money transfer product in the Global Funds Transfer segment. Any interest rate swaps
related to our credit agreements are not allocated to the segments.
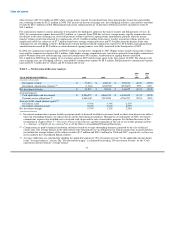
Also excluded from operating income for Global Funds Transfer and Financial Paper Products are interest and other expenses related to
our credit agreements, items related to our preferred stock, operating income from businesses categorized as "Other," certain pension and
benefit obligation expenses, director deferred compensation plan expenses, executive severance and related costs, and certain legal and
corporate costs not related to the performance of the segments. Unallocated expenses in 2009 include $20.3 million of legal reserves
related to securities litigation and stockholder derivative claims, a net curtailment gain on benefit plans of $14.3 million, $7.0 million of
asset impairments and $4.4 million of executive severance and related costs in addition to other net corporate costs of $13.0 million not
allocated to the segments. Unallocated expenses in 2008 include $16.7 million of executive
36