MoneyGram 2009 Annual Report Download - page 35
Download and view the complete annual report
Please find page 35 of the 2009 MoneyGram annual report below. You can navigate through the pages in the report by either clicking on the pages listed below, or by using the keyword search tool below to find specific information within the annual report.-
 1
1 -
2
-
3
-
4
-
5
-
6
-
7
-
8
-
9
-
10
-
11
-
12
-
13
-
14
-
15
-
16
-
17
-
18
-
19
-
20
-
21
-
22
-
23
-
24
-
 25
25 -
 26
26 -
 27
27 -
 28
28 -
 29
29 -
 30
30 -
 31
31 -
 32
32 -
 33
33 -
 34
34 -
 35
35 -
 36
36 -
 37
37 -
 38
38 -
 39
39 -
 40
40 -
 41
41 -
 42
42 -
 43
43 -
 44
44 -
 45
45 -
46
-
47
-
48
-
49
-
50
-
51
-
52
-
53
-
54
-
55
-
56
-
57
-
58
-
59
-
60
-
61
-
62
-
63
-
64
-
65
-
66
-
67
-
68
-
69
-
70
-
71
-
72
-
73
-
74
-
75
-
76
-
77
-
78
-
79
-
80
-
81
-
82
-
83
-
84
-
85
-
86
-
87
-
88
-
89
-
90
-
91
-
92
-
93
-
94
-
95
-
96
-
97
-
98
-
99
-
100
-
101
-
102
-
103
-
104
-
105
-
106
-
107
-
108
-
109
-
110
-
111
-
112
-
113
-
114
-
115
-
116
-
117
-
118
-
119
-
120
-
121
-
122
-
123
-
124
-
125
-
126
-
127
-
128
-
129
-
130
-
131
-
132
-
133
-
134
-
135
-
136
-
137
-
138
-
139
-
140
-
141
-
142
-
143
-
144
-
145
-
146
-
147
-
148
-
149
-
150
-
151
-
152
-
153
-
154
-
155
-
156
-
157
-
158
-
159
-
160
-
161
-
162
-
163
-
164
-
165
-
166
-
167
-
168
-
169
-
170
-
171
-
172
-
173
-
174
-
175
-
176
-
177
-
178
-
179
-
180
-
181
-
182
-
183
-
184
-
185
-
186
-
187
-
188
-
189
-
190
-
191
-
192
-
193
-
194
-
195
-
196
-
197
-
198
-
199
-
200
-
201
-
202
-
203
-
204
-
205
-
206
-
207
-
208
-
209
-
210
-
211
-
212
-
213
-
214
-
215
-
216
-
217
-
218
-
219
-
220
-
221
-
222
-
223
-
224
-
225
-
226
-
227
-
228
-
229
-
230
-
231
-
232
-
233
-
234
-
235
-
236
-
237
-
238
-
239
-
240
-
241
-
242
-
243
-
244
-
245
-
246
-
247
-
248
-
249
-
250
-
251
-
252
-
253
-
254
-
255
-
256
-
257
-
258
-
259
-
260
-
261
-
262
-
263
-
264
-
265
-
266
-
267
-
268
-
269
-
270
-
271
-
272
-
273
-
274
-
275
-
276
-
277
-
278
-
279
-
280
-
281
-
282
-
283
-
284
-
285
-
286
-
287
-
288
-
289
-
290
-
291
-
292
-
293
-
294
-
295
-
296
-
297
-
298
-
299
-
300
-
301
-
302
-
303
-
304
-
305
-
306
-
307
-
308
-
309
-
310
-
311
-
312
-
313
-
314
-
315
-
316
-
317
-
318
-
319
-
320
-
321
-
322
-
323
-
324
-
325
-
326
-
327
-
328
-
329
-
330
-
331
-
332
-
333
-
334
-
335
-
336
-
337
-
338
-
339
-
340
-
341
-
342
-
343
-
344
-
345
-
346
-
347
-
348
-
349
-
350
-
351
-
352
-
353
-
354
-
355
-
356
-
357
-
358
-
359
-
360
-
361
-
362
-
363
-
364
-
365
-
366
-
367
-
368
-
369
-
370
-
371
-
372
-
373
-
374
-
375
-
376
-
377
-
378
-
379
-
380
-
381
-
382
-
383
-
384
-
385
-
386
-
387
-
388
-
389
-
390
-
391
-
392
-
393
-
394
-
395
-
396
-
397
-
398
-
399
-
400
-
401
-
402
-
403
-
404
-
405
-
406
-
407
-
408
-
409
-
410
-
411
-
412
-
413
-
414
-
415
-
416
-
417
-
418
-
419
-
420
-
421
-
422
-
423
-
424
-
425
-
426
-
427
-
428
-
429
-
430
-
431
-
432
-
433
-
434
-
435
-
436
-
437
-
438
-
439
-
440
-
441
-
442
-
443
-
444
-
445
-
446
-
447
-
448
-
449
-
450
-
451
-
452
-
453
-
454
-
455
-
456
-
457
-
458
-
459
-
460
-
461
-
462
-
463
-
464
-
465
-
466
-
467
-
468
-
469
-
470
-
471
-
472
-
473
-
474
-
475
-
476
-
477
-
478
-
479
-
480
-
481
-
482
-
483
-
484
-
485
-
486
-
487
-
488
-
489
-
490
-
491
-
492
-
493
-
494
-
495
-
496
-
497
-
498
-
499
-
500
-
501
-
502
-
503
-
504
-
505
-
506
-
507
-
508
-
509
-
510
-
511
-
512
-
513
-
514
-
515
-
516
-
517
-
518
-
519
-
520
-
521
-
522
-
523
-
524
-
525
-
526
-
527
-
528
-
529
-
530
-
531
-
532
-
533
-
534
-
535
-
536
-
537
-
538
-
539
-
540
-
541
-
542
-
543
-
544
-
545
-
546
-
547
-
548
-
549
-
550
-
551
-
552
-
553
-
554
-
555
-
556
-
557
-
558
-
559
-
560
-
561
-
562
-
563
-
564
-
565
-
566
-
567
-
568
-
569
-
570
-
571
-
572
-
573
-
574
-
575
-
576
-
577
-
578
-
579
-
580
-
581
-
582
-
583
-
584
-
585
-
586
-
587
-
588
-
589
-
590
-
591
-
592
-
593
-
594
-
595
-
596
-
597
-
598
-
599
-
600
-
601
-
602
-
603
-
604
-
605
-
606
-
607
-
608
-
609
-
610
-
611
-
612
-
613
-
614
-
615
-
616
-
617
-
618
-
619
-
620
-
621
-
622
-
623
-
624
-
625
-
626
-
627
-
628
-
629
-
630
-
631
-
632
-
633
-
634
-
635
-
636
-
637
-
638
-
639
-
640
-
641
-
642
-
643
-
644
-
645
-
646
-
647
-
648
-
649
-
650
-
651
-
652
-
653
-
654
-
655
-
656
-
657
-
658
-
659
-
660
-
661
-
662
-
663
-
664
-
665
-
666
-
667
-
668
-
669
-
670
-
671
-
672
-
673
-
674
-
675
-
676
-
677
-
678
-
679
-
680
-
681
-
682
-
683
-
684
-
685
-
686
-
687
-
688
-
689
-
690
-
691
-
692
-
693
-
694
-
695
-
696
-
697
-
698
-
699
-
700
-
701
-
702
-
703
-
704
-
705
-
706
 |
 |

Table of Contents
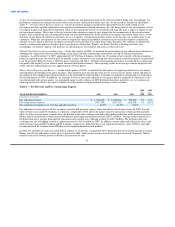
Investment revenue consists of interest and dividends generated through the investment of cash balances received from the sale of official
checks, money orders and other payment instruments. Investment revenue in 2009 decreased $128.9 million, or 80 percent, compared to
2008 due to lower yields earned on our investment portfolio and a decline in average investable balances from the termination of certain
official check financial institution customers. Lower interest rates earned on cash and cash equivalents resulted in a decrease of
$110.0 million from 2008, while the decline in average investable balances resulted in a decrease of $20.7 million. Investment revenue in
2008 also included a $10.0 million recovery of a security that was fully impaired in 2007.
In 2008, investment revenue decreased $236.1 million, or 59 percent, compared to 2007 due to lower yields earned on our realigned
investment portfolio and the decrease in average investable balances from the termination of certain official check financial institution
customers and the termination of our sale of receivables program. With the realignment completed in the first quarter of 2008, our
portfolio now primarily consists of lower yielding cash equivalents and government securities. Lower interest rates earned on cash and
cash equivalents resulted in a decrease of $134.0 million from 2007, while the decline in average investable balances resulted in a
decrease of $92.9 million. Also negatively impacting investment revenue in 2008 is the application of the cost recovery method of
accounting for investments classified as "Other asset-backed securities." Under cost recovery, interest proceeds are deemed to be
recoveries of principal, with no recognition as investment revenue until the principal of the related security is fully recovered. See
Note 6 — Investment Portfolio of the Notes to the Consolidated Financial Statements for further information related to the investment
portfolio and the application of the cost recovery method. During 2008, we received interest proceeds of $26.9 million from our other
asset-backed securities, with $10.7 million applied to reduce the book value of the related securities. The remaining $16.2 million of
interest proceeds was recognized as investment revenue in 2008, including $10.0 million related to the recovery of a security that was
fully impaired in 2007.
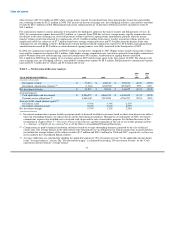
Investment commissions expense includes payments made to financial institution customers based on their average outstanding balances
generated by the sale of official checks times short-term interest rate indices. Investment commission expense decreased $100.9 million,
or 99 percent, compared to 2008. The decline in the federal funds rate resulted in a decrease of $49.7 million, while lower average
investable balances resulted in a decrease of $23.4 million. In addition, investment commissions expense for 2008 included a
$27.7 million net loss from the termination of interest rate swaps as a result of the termination of certain official check customers in 2008.
See Note 7 — Derivative Financial Instruments of the Notes to the Consolidated Financial Statements for further information regarding
the interest rate swaps. The federal funds rate has been so low during 2009 that most of our financial institution customers are in a
"negative" commission position, meaning we do not owe any commissions to our customers. While the majority of our contracts require
that the financial institution customers pay us for the negative commission amount, we have opted at this time to impose certain per-item
and other fees rather than require payment of the negative commission amount. We continue to monitor the negative commissions and
may decide to require payment of negative commissions at a future date.
In 2008, investment commissions expense decreased $151.3 million, or 60 percent, compared to 2007. Lower commission rates from the
official check repricing and the decline in the effective federal funds rate decreased commissions by $120.0 million, while lower average
investable balances decreased commissions by $35.8 million. In addition, the termination of the sales of receivable program in the first
quarter of 2008 reduced commissions expense by $20.2 million. See Note 3 — Summary of Significant Accounting Policies of the Notes
to the Consolidated Financial Statements for further information on the sale of receivables program. Partially offsetting these benefits is
the $27.7 million loss from the termination of interest rate swaps related to the official check business.
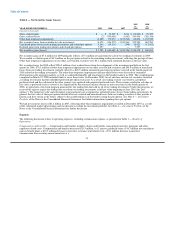
Net investment revenue decreased 47 percent in 2009 compared to 2008, reflecting the lower interest rate environment and lower average
investable balances discussed above. The net investment margin of 0.75 percent for 2009 decreased 48 basis points from 1.23 percent in
2008, reflecting these same factors. Net investment revenue decreased 59 percent in 2008 as compared to 2007, reflecting the lower
yields from the realigned portfolio, lower average investable balances and the termination loss on swaps, partially offset by the official
check repricing initiative and the decline in the effective federal funds rate. The net investment margin decreased 105 basis points from
2007 to 1.23 percent for 2008 as a result of the same factors.
32