MoneyGram 2009 Annual Report Download - page 44
Download and view the complete annual report
Please find page 44 of the 2009 MoneyGram annual report below. You can navigate through the pages in the report by either clicking on the pages listed below, or by using the keyword search tool below to find specific information within the annual report.-
 1
1 -
2
-
3
-
4
-
5
-
6
-
7
-
8
-
9
-
10
-
11
-
12
-
13
-
14
-
15
-
16
-
17
-
18
-
19
-
20
-
21
-
22
-
23
-
24
-
25
-
26
-
27
-
28
-
29
-
30
-
31
-
32
-
33
-
 34
34 -
 35
35 -
 36
36 -
 37
37 -
 38
38 -
 39
39 -
 40
40 -
 41
41 -
 42
42 -
 43
43 -
 44
44 -
 45
45 -
 46
46 -
 47
47 -
 48
48 -
 49
49 -
 50
50 -
 51
51 -
 52
52 -
 53
53 -
 54
54 -
55
-
56
-
57
-
58
-
59
-
60
-
61
-
62
-
63
-
64
-
65
-
66
-
67
-
68
-
69
-
70
-
71
-
72
-
73
-
74
-
75
-
76
-
77
-
78
-
79
-
80
-
81
-
82
-
83
-
84
-
85
-
86
-
87
-
88
-
89
-
90
-
91
-
92
-
93
-
94
-
95
-
96
-
97
-
98
-
99
-
100
-
101
-
102
-
103
-
104
-
105
-
106
-
107
-
108
-
109
-
110
-
111
-
112
-
113
-
114
-
115
-
116
-
117
-
118
-
119
-
120
-
121
-
122
-
123
-
124
-
125
-
126
-
127
-
128
-
129
-
130
-
131
-
132
-
133
-
134
-
135
-
136
-
137
-
138
-
139
-
140
-
141
-
142
-
143
-
144
-
145
-
146
-
147
-
148
-
149
-
150
-
151
-
152
-
153
-
154
-
155
-
156
-
157
-
158
-
159
-
160
-
161
-
162
-
163
-
164
-
165
-
166
-
167
-
168
-
169
-
170
-
171
-
172
-
173
-
174
-
175
-
176
-
177
-
178
-
179
-
180
-
181
-
182
-
183
-
184
-
185
-
186
-
187
-
188
-
189
-
190
-
191
-
192
-
193
-
194
-
195
-
196
-
197
-
198
-
199
-
200
-
201
-
202
-
203
-
204
-
205
-
206
-
207
-
208
-
209
-
210
-
211
-
212
-
213
-
214
-
215
-
216
-
217
-
218
-
219
-
220
-
221
-
222
-
223
-
224
-
225
-
226
-
227
-
228
-
229
-
230
-
231
-
232
-
233
-
234
-
235
-
236
-
237
-
238
-
239
-
240
-
241
-
242
-
243
-
244
-
245
-
246
-
247
-
248
-
249
-
250
-
251
-
252
-
253
-
254
-
255
-
256
-
257
-
258
-
259
-
260
-
261
-
262
-
263
-
264
-
265
-
266
-
267
-
268
-
269
-
270
-
271
-
272
-
273
-
274
-
275
-
276
-
277
-
278
-
279
-
280
-
281
-
282
-
283
-
284
-
285
-
286
-
287
-
288
-
289
-
290
-
291
-
292
-
293
-
294
-
295
-
296
-
297
-
298
-
299
-
300
-
301
-
302
-
303
-
304
-
305
-
306
-
307
-
308
-
309
-
310
-
311
-
312
-
313
-
314
-
315
-
316
-
317
-
318
-
319
-
320
-
321
-
322
-
323
-
324
-
325
-
326
-
327
-
328
-
329
-
330
-
331
-
332
-
333
-
334
-
335
-
336
-
337
-
338
-
339
-
340
-
341
-
342
-
343
-
344
-
345
-
346
-
347
-
348
-
349
-
350
-
351
-
352
-
353
-
354
-
355
-
356
-
357
-
358
-
359
-
360
-
361
-
362
-
363
-
364
-
365
-
366
-
367
-
368
-
369
-
370
-
371
-
372
-
373
-
374
-
375
-
376
-
377
-
378
-
379
-
380
-
381
-
382
-
383
-
384
-
385
-
386
-
387
-
388
-
389
-
390
-
391
-
392
-
393
-
394
-
395
-
396
-
397
-
398
-
399
-
400
-
401
-
402
-
403
-
404
-
405
-
406
-
407
-
408
-
409
-
410
-
411
-
412
-
413
-
414
-
415
-
416
-
417
-
418
-
419
-
420
-
421
-
422
-
423
-
424
-
425
-
426
-
427
-
428
-
429
-
430
-
431
-
432
-
433
-
434
-
435
-
436
-
437
-
438
-
439
-
440
-
441
-
442
-
443
-
444
-
445
-
446
-
447
-
448
-
449
-
450
-
451
-
452
-
453
-
454
-
455
-
456
-
457
-
458
-
459
-
460
-
461
-
462
-
463
-
464
-
465
-
466
-
467
-
468
-
469
-
470
-
471
-
472
-
473
-
474
-
475
-
476
-
477
-
478
-
479
-
480
-
481
-
482
-
483
-
484
-
485
-
486
-
487
-
488
-
489
-
490
-
491
-
492
-
493
-
494
-
495
-
496
-
497
-
498
-
499
-
500
-
501
-
502
-
503
-
504
-
505
-
506
-
507
-
508
-
509
-
510
-
511
-
512
-
513
-
514
-
515
-
516
-
517
-
518
-
519
-
520
-
521
-
522
-
523
-
524
-
525
-
526
-
527
-
528
-
529
-
530
-
531
-
532
-
533
-
534
-
535
-
536
-
537
-
538
-
539
-
540
-
541
-
542
-
543
-
544
-
545
-
546
-
547
-
548
-
549
-
550
-
551
-
552
-
553
-
554
-
555
-
556
-
557
-
558
-
559
-
560
-
561
-
562
-
563
-
564
-
565
-
566
-
567
-
568
-
569
-
570
-
571
-
572
-
573
-
574
-
575
-
576
-
577
-
578
-
579
-
580
-
581
-
582
-
583
-
584
-
585
-
586
-
587
-
588
-
589
-
590
-
591
-
592
-
593
-
594
-
595
-
596
-
597
-
598
-
599
-
600
-
601
-
602
-
603
-
604
-
605
-
606
-
607
-
608
-
609
-
610
-
611
-
612
-
613
-
614
-
615
-
616
-
617
-
618
-
619
-
620
-
621
-
622
-
623
-
624
-
625
-
626
-
627
-
628
-
629
-
630
-
631
-
632
-
633
-
634
-
635
-
636
-
637
-
638
-
639
-
640
-
641
-
642
-
643
-
644
-
645
-
646
-
647
-
648
-
649
-
650
-
651
-
652
-
653
-
654
-
655
-
656
-
657
-
658
-
659
-
660
-
661
-
662
-
663
-
664
-
665
-
666
-
667
-
668
-
669
-
670
-
671
-
672
-
673
-
674
-
675
-
676
-
677
-
678
-
679
-
680
-
681
-
682
-
683
-
684
-
685
-
686
-
687
-
688
-
689
-
690
-
691
-
692
-
693
-
694
-
695
-
696
-
697
-
698
-
699
-
700
-
701
-
702
-
703
-
704
-
705
-
706
 |
 |

Table of Contents
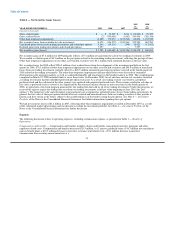
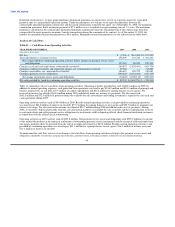
2008 Compared to 2007
For 2008, total Financial Paper Products revenue decreased $231.9 million, or 49 percent, due primarily to a $232.4 million decline in
investment revenue from lower yields earned on our realigned investment portfolio and the decrease in our investment balances from the
termination of official check financial institution customers and the termination of our sale of receivables program. See Table 3 — Net
Investment Revenue Analysis for further information.
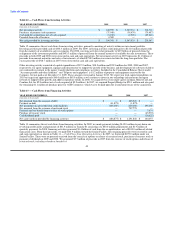
For 2008 and 2007, commissions expense includes costs associated with interest rate swaps used to hedge our variable rate commission
payments and costs related to the sale of receivables program which was terminated in the first quarter of 2008. In 2008, commissions
expense decreased $152.4 million, or 58 percent, due primarily to lower average investable balances, lower commission rates from the
official check repricing and the decline in the effective federal funds rate. See Table 3 — Net Investment Revenue Analysis for further
information. In addition, commissions expense in 2007 included $22.3 million of expense related to the sale of receivables program,
while minimal expense was incurred in 2008 as the program was terminated in the first quarter of 2008. Partially offsetting these benefits
is a $27.7 million net loss resulting from the termination of interest rate swaps related to the official check business. See Note 7 —
Derivative Financial Instruments of the Notes to Consolidated Financial Statements for further information regarding the terminations of
the interest rate swaps.
Operating income for 2008 of $30.2 million decreased from operating income of $93.3 million in 2007 reflecting the decrease in revenue.
The net investment margin of 1.20 percent in 2008 as compared to 2.21 percent in 2007 reflects the lower yields on our realigned
portfolio, partially offset by lower commission rates from the repricing initiatives and the declining federal funds rate. As the lower
commission rates did not go into effect until the second half of 2008, the lower yields on the portfolio offset the benefits of the repricing
initiatives.
Trends Expected to Impact 2010
The discussion of trends expected to impact 2010 is based on information presently available and contains certain assumptions regarding
future economic conditions. Differences in actual economic conditions during 2010 compared with our assumptions could have a material
impact on our results. See "Cautionary Statements Regarding Forward-Looking Statements" and Part I, Item 1A, Risk Factors of this
Annual Report on Form 10-K for additional factors that could cause results to differ materially from those contemplated by the following
forward-looking statements.
Throughout 2009, global economic conditions remained weak. We cannot predict the duration or extent of severity of these economic
conditions, nor the extent to which these conditions could negatively affect our business, operating results or financial condition. While
the money remittance industry has generally been resilient during times of economic softness, the current global economic conditions
have continued to adversely impact the demand for money remittances. Given the global economic uncertainty, we have less visibility to
the future and believe growth rates could continue to be impacted by slow economic conditions. In addition, bill payment products
available in the United States have not been as resilient as money transfers given the more discretionary nature of items paid for by
consumers using these products.
While there is great uncertainty around when the global economy and the remittance industry will begin to improve, the World Bank, a
key source of industry analysis for developing countries, is projecting flat to modest remittance growth in 2010. This is consistent with
our expectations for modest money transfer volume growth. We expect this growth to be driven by agent expansion and increasing
productivity in our existing agent locations through marketing support, customer acquisition and new product innovation. We believe
these efforts will not only help to counteract the current global economic conditions, but position us for enhanced market share and strong
growth when the economy begins to recover.
For our Financial Paper Products segment, we expect the decline in overall paper-based transactions to continue in 2010. Given the
current interest rate environment, we expect our net investment margin to decline as our cash and cash equivalents will likely reset to
lower rates. As described earlier, the effective federal funds rate was so low throughout 2009 that commissions to most of our financial
institution customers were negative during the year. While we expect the effective federal funds rate to remain at their current historic
lows throughout 2010, we do not expect any benefit to commission expense in 2010 to offset the likely decline in investment yields. Any
increase in interest rates in 2010 will also negatively impact our investment margin due to the lagging impact of rising rates on our
investment portfolio.
41