Home Depot 2002 Annual Report Download - page 42
Download and view the complete annual report
Please find page 42 of the 2002 Home Depot annual report below. You can navigate through the pages in the report by either clicking on the pages listed below, or by using the keyword search tool below to find specific information within the annual report.-
 1
1 -
2
-
3
-
4
-
5
-
6
-
7
-
8
-
9
-
10
-
11
-
12
-
13
-
14
-
15
-
16
-
17
-
18
-
19
-
20
-
21
-
22
-
23
-
24
-
25
-
26
-
27
-
28
-
29
-
30
-
31
-
 32
32 -
 33
33 -
 34
34 -
 35
35 -
 36
36 -
 37
37 -
 38
38 -
 39
39 -
 40
40 -
 41
41 -
 42
42 -
 43
43 -
 44
44 -
 45
45 -
 46
46 -
 47
47 -
 48
48
 |
 |

NOTES TO CONSOLIDATED FINANCIAL STATEMENTS (CONTINUED)
THE HOME DEPOT, INC. AND SUBSIDIARIES
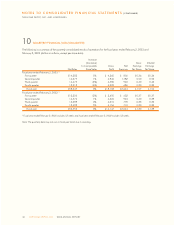
10 QUARTERLY FINANCIAL DATA (UNAUDITED)
The following is a summary of the quarterly consolidated results of operations for the fiscal years ended February 2, 2003 and
February 3, 2002 (dollars in millions, except per share data):
Increase
(Decrease) Basic Diluted
In Comparable Gross Net Earnings Earnings
Net Sales Store Sales Profit Earnings Per Share Per Share
Fiscal year ended February 2, 2003:(1)
First quarter $14,282 5% $ 4,360 $ 856 $0.36 $0.36
Second quarter 16,277 1% 4,946 1,182 0.50 0.50
Third quarter 14,475 (2%) 4,580 940 0.40 0.40
Fourth quarter 13,213 (6%) 4,222 686 0.30 0.30
Fiscal year $58,247 0% $18,108 $3,664 $ 1.57 $ 1.56
Fiscal year ended February 3, 2002:(1)
First quarter $12,200 (3%) $ 3,655 $ 632 $0.27 $0.27
Second quarter 14,576 1% 4,326 924 0.40 0.39
Third quarter 13,289 0% 4,010 778 0.33 0.33
Fourth quarter 13,488 5% 4,156 710 0.30 0.30
Fiscal year $53,553 0% $16,147 $3,044 $ 1.30 $ 1.29
(1)Fiscal year ended February 2, 2003 includes 52 weeks and fiscal year ended February 3, 2002 includes 53 weeks.
Note: The quarterly data may not sum to fiscal year totals due to rounding.
40 THE HOME DEPOT, INC. 2002 ANNUAL REPORT