Home Depot 2002 Annual Report Download - page 24
Download and view the complete annual report
Please find page 24 of the 2002 Home Depot annual report below. You can navigate through the pages in the report by either clicking on the pages listed below, or by using the keyword search tool below to find specific information within the annual report.-
 1
1 -
2
-
3
-
4
-
5
-
6
-
7
-
8
-
9
-
10
-
11
-
12
-
13
-
 14
14 -
 15
15 -
 16
16 -
 17
17 -
 18
18 -
 19
19 -
 20
20 -
 21
21 -
 22
22 -
 23
23 -
 24
24 -
 25
25 -
 26
26 -
 27
27 -
 28
28 -
 29
29 -
 30
30 -
 31
31 -
 32
32 -
 33
33 -
 34
34 -
35
-
36
-
37
-
38
-
39
-
40
-
41
-
42
-
43
-
44
-
45
-
46
-
47
-
48
 |
 |

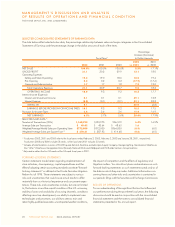
MANAGEMENT’S DISCUSSION AND ANALYSIS
OF RESULTS OF OPERATIONS AND FINANCIAL CONDITION
THE HOME DEPOT, INC. AND SUBSIDIARIES
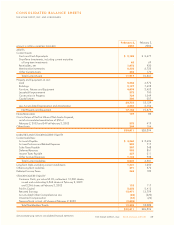
SELECTED CONSOLIDATED STATEMENTS OF EARNINGS DATA
The data below reflect selected sales data, the percentage relationship between sales and major categories in the Consolidated
Statements of Earnings and the percentage change in the dollar amounts of each of the items.
Percentage
Increase (Decrease)
Fiscal Year(1) In Dollar Amounts
2002 2001
2002 2001 2000 vs. 2001 vs. 2000
NET SALES 100.0% 100.0% 100.0% 8.8% 17.1%
GROSS PROFIT 31.1 30.2 29.9 12.1 18.0
Operating Expenses:
Selling and Store Operating 19.2 19.0 18.6 10.0 19.4
Pre-Opening 0.2 0.2 0.3 (17.9) (17.6)
General and Administrative 1.7 1. 7 1. 8 7.2 12.0
Total Operating Expenses 21.1 20.9 20.7 9.5 18.2
OPERATING INCOME 10.0 9.3 9.2 18.2 17.7
Interest Income (Expense):
Interest and Investment Income 0.1 0.1 0.1 49.1 12.8
Interest Expense (0.0) (0.1) (0.1) 32.1 33.3
Interest, net 0.1 ––68.0 (3.8)
EARNINGS BEFORE PROVISION FOR INCOME TAXES 10.1 9.3 9.2 18.5 17.5
Provision for Income Taxes 3.8 3.6 3.6 15.4 16.9
NET EARNINGS 6.3% 5.7% 5.6% 20.4% 17.9%
SELECTED SALES DATA (2)
Number of Transactions (000s) 1,160,994 1,090,975 936,519 6.4% 16.5%
Average Sale per Transaction $ 49.43 $ 48.64 $ 48.65 1.6 –
Weighted Average Weekly Sales per Operating Store $772,000 $812,000 $864,000 (4.9) (6.0)
Weighted Average Sales per Square Foot (3) $ 370.21 $ 387.93 $ 414.68 (4.6) (6.5)
(1) Fiscal years 2002, 2001 and 2000 refer to the fiscal years ended February 2, 2003, February 3, 2002 and January 28, 2001, respectively.
Fiscal years 2002 and 2000 include 52 weeks, while fiscal year 2001 includes 53 weeks.
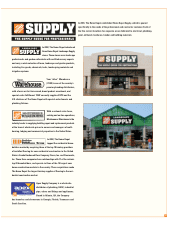
(2) Includes all retail locations in excess of 50,000 square feet and, therefore, excludes Apex Supply Company, Georgia Lighting, Maintenance Warehouse,
Your “other” Warehouse, Designplace Direct (formerly National Blinds and Wallpaper) and HD Builder Solutions Group locations.
(3) Adjusted to reflect the first 52 weeks of the 53-week fiscal year in 2001.
22 THE HOME DEPOT, INC. 2002 ANNUAL REPORT
FORWARD-LOOKING STATEMENTS
Certain statements made herein regarding implementation of
store initiatives, store openings, capital expenditures and the
effect of adopting certain accounting standards constitute “forward-
looking statements” as defined in the Private Securities Litigation
Reform Act of 1995. These statements are subject to various
risks and uncertainties that could cause actual results to differ
materially from our historical experience and our present expec-
tations. These risks and uncertainties include, but are not limited
to, fluctuations in and the overall condition of the U.S. economy,
stability of costs and availability of sourcing channels, conditions
affecting new store development, our ability to implement new
technologies and processes, our ability to attract, train and
retain highly-qualified associates, unanticipated weather conditions,
the impact of competition and the effects of regulatory and
litigation matters. You should not place undue reliance on such
forward-looking statements as such statements speak only as of
the date on which they are made. Additional information con-
cerning these and other risks and uncertainties is contained in
our periodic filings with the Securities and Exchange Commission.
RESULTS OF OPERATIONS
For an understanding of the significant factors that influenced
our performance during the past three fiscal years, the following
discussion should be read in conjunction with the consolidated
financial statements and the notes to consolidated financial
statements presented in this annual report.