Home Depot 2002 Annual Report Download - page 25
Download and view the complete annual report
Please find page 25 of the 2002 Home Depot annual report below. You can navigate through the pages in the report by either clicking on the pages listed below, or by using the keyword search tool below to find specific information within the annual report.-
 1
1 -
2
-
3
-
4
-
5
-
6
-
7
-
8
-
9
-
10
-
11
-
12
-
13
-
14
-
 15
15 -
 16
16 -
 17
17 -
 18
18 -
 19
19 -
 20
20 -
 21
21 -
 22
22 -
 23
23 -
 24
24 -
 25
25 -
 26
26 -
 27
27 -
 28
28 -
 29
29 -
 30
30 -
 31
31 -
 32
32 -
 33
33 -
 34
34 -
 35
35 -
36
-
37
-
38
-
39
-
40
-
41
-
42
-
43
-
44
-
45
-
46
-
47
-
48
 |
 |

MANAGEMENT’S DISCUSSION AND ANALYSIS
OF RESULTS OF OPERATIONS AND FINANCIAL CONDITION (CONTINUED)
THE HOME DEPOT, INC. AND SUBSIDIARIES
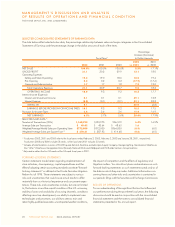
Fiscal year ended February 2, 2003 (“fiscal 2002”) compared
to fiscal year ended February 3, 2002 (“fiscal 2001”)
Fiscal 2002 included 52 weeks as compared to 53 weeks in fiscal
2001. Net sales for fiscal 2002 increased 8.8% to $58.2 billion
from $53.6 billion in fiscal 2001. This increase was attributable
to the 203 new stores opened during fiscal 2002 and full year
sales from the 204 new stores opened during fiscal 2001. The
increase was partially offset by the net sales attributable to the
additional week in fiscal 2001 of $880 million.
Comparable store-for-store sales were flat in fiscal 2002,
reflecting a number of internal and external factors. In the spring
and early summer, we experienced some inventory out-of-stock
positions as we transitioned through our new in-store Service
Performance Improvement (“SPI”) initiative, in which our stores
handle and receive inventory at night. In addition, comparable
store-for-store sales were negatively impacted by the level of
merchandise resets implemented throughout the year, which
disrupted in-store service and had a negative impact on our
customers’ experience in our stores. Kitchen and bath, plumbing
and paint categories experienced strong comparable store-
for-store sales growth for the year, which offset price deflation
and the resulting comparable store-for-store sales decline in
commodity categories such as lumber.
In order to meet our customer service objectives, we strate-
gically open stores near market areas served by existing strong
performing stores (“cannibalize”) to enhance service levels, gain
incremental sales and increase market penetration. As of the
end of fiscal 2002, certain new stores cannibalized 21% of
our existing stores and we estimate that store cannibalization
reduced total comparable store-for-store sales by approximately
4%, or about the same percentage as in the prior year. As we
heavily cannibalized our most productive divisions, the weighted
average weekly sales per store decreased during fiscal 2002 to
$772,000 from $812,000 in the prior year. Additionally, we
believe that our sales performance has been, and could con-
tinue to be, negatively impacted by the level of competition that
we encounter in various markets. However, due to the highly-
fragmented U.S. home improvement industry, in which we esti-
mate our market share is approximately 10%, measuring the
impact on our sales by our competitors is extremely difficult.
During fiscal 2002, we continued the implementation or
expansion of a number of in-store initiatives. We believe these
initiatives will increase customer loyalty and operating efficien-
cies as they are fully implemented in the stores. The professional
business customer (“Pro”) initiative adds programs to our stores
to enhance service levels to the Pro customer base. As of the end
of fiscal 2002, the Pro initiative was in 1,135 stores or 74% of
total stores, compared to 535 stores or 40% of total stores as of
the end of fiscal 2001. This initiative is still in its early stages as
approximately half of our stores implemented the Pro initiative in
fiscal 2002. We expect to add the Pro initiative to an additional
204 stores by the end of fiscal 2003. As the Pro initiative matures
within the stores in which it has been implemented, we expect to
generate improvements in operating performance.
We continued to implement the Appliance initiative which
was started in the third quarter of fiscal 2001. The Appliance
initiative offers customers an assortment of in-stock name brand
appliances, including General Electric®and Maytag®, and offers
the ability to special order over 2,300 additional related products
through computer kiosks located in the stores. In the stores which
have implemented the Appliance initiative, we have enhanced
the offering of appliances through 1,500 to 2,000 square feet
of dedicated appliance selling space. Comparable store-for-store
sales in the appliance category increased by approximately 23%
in fiscal 2002. The Appliance initiative was in 743 or 48% of our
stores as of the end of fiscal 2002, compared to 73 or 5% of our
stores as of the end of fiscal 2001. We expect to add the Appliance
initiative to an additional 671 stores by the end of fiscal 2003.
We also continued to implement our Designplace initiative.
This initiative offers an enhanced shopping experience to our
design and décor customers by providing personalized service
from specially-trained associates and an enhanced merchandise
selection in an attractive setting. Although the Designplace
initiative is in its early stages, stores generally show a positive sales
trend after implementation. The Designplace initiative was in 873 or
57% of our stores as of the end of fiscal 2002, compared to
205 or 15% of our stores as of the end of fiscal 2001. We expect
to add the Designplace initiative to an additional 556 stores by
the end of fiscal 2003.
In addition, we continued to drive our services programs,
which focus primarily on providing products and services to our
do-it-for-me customers. These programs are offered through
Home Depot and EXPO Design Center stores. We also arrange
for the provision of flooring installation services to homebuilders
through HD Builder Solutions Group, Inc. Net service revenues
for fiscal 2002 increased 25% to $2.0 billion from $1.6 billion
for fiscal 2001.
Gross profit as a percent of sales was 31.1% for fiscal 2002
compared to 30.2% for fiscal 2001. The rate increase was
attributable to a reduction in the cost of merchandise sold which
resulted from centralized purchasing, as we continued rational-
izing vendor and sku assortments. Enhanced inventory control,
resulting in lower shrink levels, and an increase in direct import
penetration to 8% in fiscal 2002 from 6% in fiscal 2001also
positively impacted the gross profit rate.
Operating expenses as a percent of sales were 21.1% for
fiscal 2002 compared to 20.9% for fiscal 2001. Included in
operating expenses are selling and store operating expenses
which, as a percent of sales, increased to 19.2% in fiscal 2002
from 19.0% in fiscal 2001. The increase in selling and store
THE HOME DEPOT, INC. 2002 ANNUAL REPORT 23