Home Depot 2002 Annual Report Download - page 22
Download and view the complete annual report
Please find page 22 of the 2002 Home Depot annual report below. You can navigate through the pages in the report by either clicking on the pages listed below, or by using the keyword search tool below to find specific information within the annual report.-
 1
1 -
2
-
3
-
4
-
5
-
6
-
7
-
8
-
9
-
10
-
11
-
 12
12 -
 13
13 -
 14
14 -
 15
15 -
 16
16 -
 17
17 -
 18
18 -
 19
19 -
 20
20 -
 21
21 -
 22
22 -
 23
23 -
 24
24 -
 25
25 -
 26
26 -
 27
27 -
 28
28 -
 29
29 -
 30
30 -
 31
31 -
 32
32 -
33
-
34
-
35
-
36
-
37
-
38
-
39
-
40
-
41
-
42
-
43
-
44
-
45
-
46
-
47
-
48
 |
 |
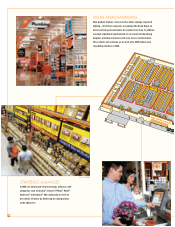
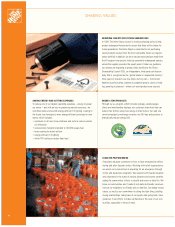
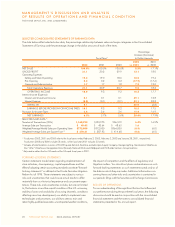
FUNDAMENTALS
More than 1.16 billion customer transactions per year and an average
ticket of $49.43 drove total sales growth for our Company in fiscal
2002. Strong gains in gross margin, driven by our centralized mer-
chandising organization, drove profitability to record highs.
REINVESTING FOR FUTURE
GROWTH WHILE PROTECTING
CORE INVESTMENTS
In fiscal 2002, our capital expenditures totaled $2.7 billion, primarily
funding the construction of 203 new stores. In fiscal 2003, we will
increase our capital spending by 48% to $4 billion, in support of
both new and existing stores, as well as technology innovations.
We have targeted $250 million for store remodels, $360 million for
technology and $360 million for other store initiatives.
REINVESTING IN OUR COMPANY
In fiscal 2002, we completed a $2 billion share repurchase program,
or approximately 69 million shares of our common stock. In addition,
we increased our quarterly dividend by 20% in the fourth quarter.
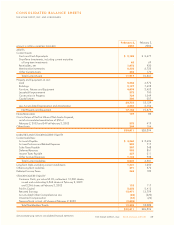
BALANCE SHEET STRENGTH
The Home Depot’s financial strength ranks among the best in retailing.
At the end of fiscal 2002, we had total equity of $19.8 billion, with
a long-term debt-to-equity ratio of 6.7%, and strong liquidity with
$2.3 billion in cash and short-term investments. We own 82% of our
stores, which are unencumbered, and drive high returns on the capital
we have invested in our business.
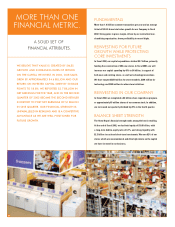
WE BELIEVE THAT VALUE IS CREATED BY SALES
GROWTH AND INCREASING RATES OF RETURN
ON THE CAPITAL WE INVEST. IN 2002, OUR SALES
GREW BY APPROXIMATELY $4.6 BILLION AND OUR
RETURN ON INVESTED CAPITAL GREW BY 50 BASIS
POINTS TO 18.8%. WE REPORTED $3.7 BILLION IN
NET EARNINGS FOR THE YEAR, AND IN THE SECOND
QUARTER OF 2002 BECAME THE SECOND RETAILER
IN HISTORY TO POST NET EARNINGS OF $1 BILLION
IN ONE QUARTER. OUR FINANCIAL STRENGTH IS
UNPARALLELED IN RETAILING AND IS A COMPETITIVE
ADVANTAGE AS WE ARE WELL POSITIONED FOR
FUTURE GROWTH.
A SOLID SET OF
FINANCIAL ATTRIBUTES.
MORE THAN ONE
FINANCIAL METRIC.
20