Home Depot 2002 Annual Report Download - page 39
Download and view the complete annual report
Please find page 39 of the 2002 Home Depot annual report below. You can navigate through the pages in the report by either clicking on the pages listed below, or by using the keyword search tool below to find specific information within the annual report.-
 1
1 -
2
-
3
-
4
-
5
-
6
-
7
-
8
-
9
-
10
-
11
-
12
-
13
-
14
-
15
-
16
-
17
-
18
-
19
-
20
-
21
-
22
-
23
-
24
-
25
-
26
-
27
-
28
-
 29
29 -
 30
30 -
 31
31 -
 32
32 -
 33
33 -
 34
34 -
 35
35 -
 36
36 -
 37
37 -
 38
38 -
 39
39 -
 40
40 -
 41
41 -
 42
42 -
 43
43 -
 44
44 -
 45
45 -
 46
46 -
 47
47 -
 48
48
 |
 |

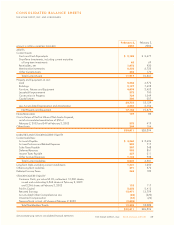
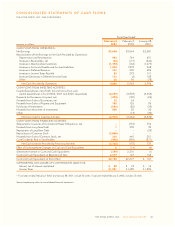
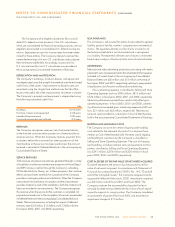
NOTES TO CONSOLIDATED FINANCIAL STATEMENTS (CONTINUED)
THE HOME DEPOT, INC. AND SUBSIDIARIES
The Company recorded stock compensation expense related to
deferred stock units of $12 million, $16 million and $6 million
in fiscal 2002, 2001 and 2000, respectively.
The per share weighted average fair value of stock options
granted during fiscal years 2002, 2001 and 2000 was $17.34,
$20.51 and $31.96, respectively. The fair value of these options
was determined at the date of grant using the Black-Scholes
option-pricing model with the following assumptions:
Fiscal Year Ended
February 2, February 3, January 28,
2003 2002 2001
Risk-free interest rate 4.0% 5.1% 6.4%
Assumed volatility 44.3% 48.1% 54.6%
Assumed dividend yield 0.5% 0.4% 0.3%
Assumed lives of options 5 years 6 years 7 years
The Company applies APB 25 in accounting for its stock-
based compensation plans and, accordingly, no compensation
expense has been recognized in the Company’s financial state-
ments for incentive or non-qualified stock options granted. If,
under SFAS No. 123, the Company determined compensation
expense based on the fair value at the grant date for its stock
options, as computed and disclosed above, net earnings and
earnings per share would have been reduced to the pro forma
amounts below (in millions, except per share data):
Fiscal Year Ended
February 2, February 3, January 28,
2003 2002 2001
Net earnings,
as reported $3,664 $3,044 $2,581
Add: Stock-based
compensation expense
included in reported net
earnings, net of related
tax effects 10 13 4
Deduct: Total stock-based
compensation expense
determined under
fair value based method
for all awards, net of
related tax effects (260) (257) (221)
Pro forma net earnings $3,414 $2,800 $2,364
Earnings per share:
Basic – as reported $ 1.57 $ 1.30 $ 1.11
Basic – pro forma $ 1.46 $ 1.20 $ 1.02
Diluted – as reported $ 1.56 $ 1.29 $ 1.10
Diluted – pro forma $ 1.46 $ 1.19 $ 1.01
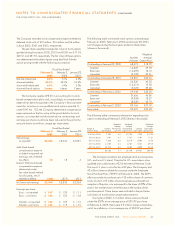
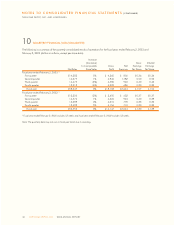
The following table summarizes stock options outstanding at
February 2, 2003, February 3, 2002 and January 28, 2001,
and changes during the fiscal years ended on these dates
(shares in thousands):
Weighted
Number Average
of Shares Option Price
Outstanding at January 30, 2000 68,419 $18.79
Granted 14,869 49.78
Exercised (14,689) 13.15
Canceled (2,798) 30.51
Outstanding at January 28, 2001 65,801 $26.46
Granted 25,330 40.33
Exercised (16,614) 15.03
Canceled (5,069) 39.20
Outstanding at February 3, 2002 69,448 $33.33
Granted 31,656 40.86
Exercised (9,908) 18.27
Canceled (8,030) 42.74
Outstanding at February 2, 2003 83,166 $37.09
Exercisable 29,431 $29.48
The following table summarizes information regarding stock
options outstanding at February 2, 2003 (shares in thousands):
Weighted Weighted Weighted
Average Average Average
Range of Options Remaining Outstanding Options Exercisable
Exercise Prices Outstanding Life (Yrs) Option Price Exercisable Option Price
$ 6.00 to 12.00 7,090 3.5 $10.24 7,090 $10.24
12.01 to 20.00 1,191 4.7 17.21 1,191 17.21
20.01 to 30.00 7,438 5.6 22.19 6,090 21.78
30.01 to 42.00 41,745 8.4 37.67 11,161 39.12
42.01 to 54.00 25,702 8.5 48.80 3,899 52.48
83,166 7.7 $37.09 29,431 $29.48
The Company maintains two employee stock purchase plans
(U.S. and non-U.S. plans). The plan for U.S. associates is a tax-
qualified plan under Section 423 of the Internal Revenue Code.
The non-U.S. plan is not a Section 423 plan. The Company had
43 million shares available for issuance under the Employee
Stock Purchase Plans (“ESPPs”) at February 2, 2003. The ESPPs
allow associates to purchase up to 152 million shares of common
stock, of which 109 million shares have been purchased from
inception of the plan, at a price equal to the lower of 85% of the
stock’s fair market value on the first day or the last day of the
purchase period. These shares were included in the pro forma
calculation of stock-based compensation expense.
During fiscal 2002, 5.2 million shares were purchased
under the ESPPs at an average price of $30.89 per share.
At February 2, 2003, there were 2.3 million shares outstanding,
net of cancellations, at an average price of $34.09 per share.
THE HOME DEPOT, INC. 2002 ANNUAL REPORT 37