Home Depot 2002 Annual Report Download - page 26
Download and view the complete annual report
Please find page 26 of the 2002 Home Depot annual report below. You can navigate through the pages in the report by either clicking on the pages listed below, or by using the keyword search tool below to find specific information within the annual report.-
 1
1 -
2
-
3
-
4
-
5
-
6
-
7
-
8
-
9
-
10
-
11
-
12
-
13
-
14
-
15
-
 16
16 -
 17
17 -
 18
18 -
 19
19 -
 20
20 -
 21
21 -
 22
22 -
 23
23 -
 24
24 -
 25
25 -
 26
26 -
 27
27 -
 28
28 -
 29
29 -
 30
30 -
 31
31 -
 32
32 -
 33
33 -
 34
34 -
 35
35 -
 36
36 -
37
-
38
-
39
-
40
-
41
-
42
-
43
-
44
-
45
-
46
-
47
-
48
 |
 |

MANAGEMENT’S DISCUSSION AND ANALYSIS
OF RESULTS OF OPERATIONS AND FINANCIAL CONDITION (CONTINUED)
THE HOME DEPOT, INC. AND SUBSIDIARIES
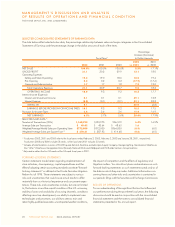
operating expenses was primarily attributable to higher costs
associated with merchandise resets and store renovations as we
invested in new signage, fixtures and general maintenance of our
stores, a continued investment in store leadership positions in our
stores and rising workers’ compensation expense due in part to
medical cost inflation. These increases were partially offset by a
decrease in store payroll expense which resulted from improve-
ment in labor productivity and effective wage rate management.
Pre-opening expenses as a percent of sales were 0.2% for
both fiscal 2002 and fiscal 2001. We opened 203 new stores in
fiscal 2002 as compared to 204 new stores in fiscal 2001.
General and administrative expenses as a percent of sales
were 1.7% for both fiscal 2002 and fiscal 2001.
Interest and investment income as a percent of sales was
0.1% for both fiscal 2002 and 2001. Interest expense as a per-
cent of sales was 0.0% for fiscal 2002 and 0.1% for fiscal 2001.
Our combined federal and state effective income tax rate
decreased to 37.6% for fiscal 2002 from 38.6% for fiscal 2001.
The decrease in fiscal 2002 was attributable to higher tax
credits and a lower effective state income tax rate compared
to fiscal 2001.
Fiscal 2001 compared to fiscal year ended January 28, 2001
(“fiscal 2000”)
Fiscal 2001 included 53 weeks as compared to 52 weeks in fiscal
2000. Net sales for fiscal 2001 increased 17.1% to $53.6 billion
from $45.7 billion in fiscal 2000. This increase was attributable
to, among other things, the 204 new stores opened during
fiscal 2001 and full year sales from the 204 new stores opened
during fiscal 2000. Approximately $880 million of the increase
in sales was attributable to the additional week in fiscal 2001.
Comparable store-for-store sales were flat in fiscal 2001 due
to the weak economic environment resulting from certain factors
including, but not limited to, low consumer confidence and
high unemployment.
Gross profit as a percent of sales was 30.2% for fiscal
2001 compared to 29.9% for fiscal 2000. The rate increase
was primarily attributable to a lower cost of merchandise result-
ing from product line reviews, purchasing synergies created by
our newly centralized merchandising structure and an increase
in the number of tool rental centers from 342 at the end of fiscal
2000 to 466 at the end of fiscal 2001.
Operating expenses as a percent of sales were 20.9% for
fiscal 2001 compared to 20.7% for fiscal 2000. Included in
operating expenses are selling and store operating expenses
which, as a percent of sales, increased to 19.0% in fiscal 2001
from 18.6% in fiscal 2000. The increase was primarily attributa-
ble to growth in store occupancy costs resulting from higher
depreciation and property taxes due to our investment in new
stores, combined with increased energy costs. Also, credit card
transaction fees were higher than the prior year due to increased
penetration of total credit sales. These increases were partially
offset by a decrease in store payroll expense due to an improve-
ment in labor productivity which resulted from initiatives inside
the store and new systems enhancements.
Store initiatives included our SPI initiative which was intro-
duced to every Home Depot store in fiscal 2001. Under SPI our
stores receive and handle inventory at night, allowing our associ-
ates to spend more time with customers during peak selling
hours. In addition, our Pro program was in 535 of our Home
Depot stores at the end of fiscal 2001, providing dedicated store
resources to serve the specific needs of professional customers.
Pre-opening expenses as a percent of sales were 0.2% for
fiscal 2001 and 0.3% for fiscal 2000. We opened 204 new
stores in both fiscal 2001 and 2000. The decrease was primarily
due to shorter pre-opening periods as we re-engineered our
store opening process.
General and administrative expenses as a percent of sales
were 1.7% for fiscal 2001 compared to 1.8% for fiscal 2000.
This decrease was primarily due to cost savings associated with
the reorganization of certain components of our organizational
structure, such as the centralization of our merchandising
organization and our focus on expense control in areas such
as travel.
Interest and investment income as a percent of sales was
0.1% for both fiscal 2001 and 2000. Interest expense as a
percent of sales was 0.1% for both fiscal 2001 and 2000.
Our combined federal and state effective income tax rate
decreased to 38.6% for fiscal 2001 from 38.8% for fiscal 2000.
The decrease in fiscal 2001 was attributable to higher tax
credits and a lower effective state income tax rate compared
to fiscal 2000.
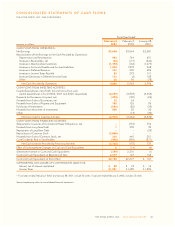
LIQUIDITY AND CAPITAL RESOURCES
Cash flow generated from operations provides us with a signifi-
cant source of liquidity. For fiscal 2002, cash provided by oper-
ations decreased to $4.8 billion from $6.0 billion in fiscal 2001.
The decrease was primarily due to a 7.9% increase in average
inventory per store resulting from our focus on improving our
in-stock position in fiscal 2002.
During fiscal 2002, we experienced a significant growth in
days payable outstanding to 42 days at the end of fiscal 2002
from 34 days at the end of fiscal 2001. The growth in days
payable is the result of our efforts to move our payment terms to
industry averages. We have realized the majority of the benefit
from our renegotiated payment terms.
24 THE HOME DEPOT, INC. 2002 ANNUAL REPORT