HSBC 2002 Annual Report Download - page 93
Download and view the complete annual report
Please find page 93 of the 2002 HSBC annual report below. You can navigate through the pages in the report by either clicking on the pages listed below, or by using the keyword search tool below to find specific information within the annual report.-
 1
1 -
2
-
3
-
4
-
5
-
6
-
7
-
8
-
9
-
10
-
11
-
12
-
13
-
14
-
15
-
16
-
17
-
18
-
19
-
20
-
21
-
22
-
23
-
24
-
25
-
26
-
27
-
28
-
29
-
30
-
31
-
32
-
33
-
34
-
35
-
36
-
37
-
38
-
39
-
40
-
41
-
42
-
43
-
44
-
45
-
46
-
47
-
48
-
49
-
50
-
51
-
52
-
53
-
54
-
55
-
56
-
57
-
58
-
59
-
60
-
61
-
62
-
63
-
64
-
65
-
66
-
67
-
68
-
69
-
70
-
71
-
72
-
73
-
74
-
75
-
76
-
77
-
78
-
79
-
80
-
81
-
82
-
 83
83 -
 84
84 -
 85
85 -
 86
86 -
 87
87 -
 88
88 -
 89
89 -
 90
90 -
 91
91 -
 92
92 -
 93
93 -
 94
94 -
 95
95 -
 96
96 -
 97
97 -
 98
98 -
 99
99 -
 100
100 -
 101
101 -
 102
102 -
 103
103 -
104
-
105
-
106
-
107
-
108
-
109
-
110
-
111
-
112
-
113
-
114
-
115
-
116
-
117
-
118
-
119
-
120
-
121
-
122
-
123
-
124
-
125
-
126
-
127
-
128
-
129
-
130
-
131
-
132
-
133
-
134
-
135
-
136
-
137
-
138
-
139
-
140
-
141
-
142
-
143
-
144
-
145
-
146
-
147
-
148
-
149
-
150
-
151
-
152
-
153
-
154
-
155
-
156
-
157
-
158
-
159
-
160
-
161
-
162
-
163
-
164
-
165
-
166
-
167
-
168
-
169
-
170
-
171
-
172
-
173
-
174
-
175
-
176
-
177
-
178
-
179
-
180
-
181
-
182
-
183
-
184
-
185
-
186
-
187
-
188
-
189
-
190
-
191
-
192
-
193
-
194
-
195
-
196
-
197
-
198
-
199
-
200
-
201
-
202
-
203
-
204
-
205
-
206
-
207
-
208
-
209
-
210
-
211
-
212
-
213
-
214
-
215
-
216
-
217
-
218
-
219
-
220
-
221
-
222
-
223
-
224
-
225
-
226
-
227
-
228
-
229
-
230
-
231
-
232
-
233
-
234
-
235
-
236
-
237
-
238
-
239
-
240
-
241
-
242
-
243
-
244
-
245
-
246
-
247
-
248
-
249
-
250
-
251
-
252
-
253
-
254
-
255
-
256
-
257
-
258
-
259
-
260
-
261
-
262
-
263
-
264
-
265
-
266
-
267
-
268
-
269
-
270
-
271
-
272
-
273
-
274
-
275
-
276
-
277
-
278
-
279
-
280
-
281
-
282
-
283
-
284
-
285
-
286
-
287
-
288
-
289
-
290
-
291
-
292
-
293
-
294
-
295
-
296
-
297
-
298
-
299
-
300
-
301
-
302
-
303
-
304
-
305
-
306
-
307
-
308
-
309
-
310
-
311
-
312
-
313
-
314
-
315
-
316
-
317
-
318
-
319
-
320
-
321
-
322
-
323
-
324
-
325
-
326
-
327
-
328
-
329
 |
 |
91
yielding assets. Net interest income also benefited
as Treasury continued to grow the proportion of its
liquid assets held in high quality corporate bonds
as opposed to interbank placement. Increased
equity swap activity also generated additional cash
deposits. The effect of the above was offset by
significant reductions in net interest income in
South America, due to the large non-performing
loan book in Argentina. Corporate loan demand
continued to be subdued.
Net fees and commissions increased by US$24
million or 1 per cent. There was higher income
from merchant banking activities, particularly in
Asia-Pacific, where transactions were structured
for a number of key CIBM relationships. Debt
capital markets activity also grew in Europe and
Asia-Pacific, by 30 per cent to US$175 million, as
origination and syndication revenues benefited
from the continuing alignment between client
service teams. The global new equity issues and
financial advisory markets continued to be
depressed, and trading volumes on the world’s
stock markets remained at subdued levels
negatively impacting commission revenues. In
asset management revenues were reduced,
consistent with the fall in the level of world stock
market indices seen during the year.
Dealing profits decreased by US$403 million
or 29 per cent. In Europe there was strong growth
in trading revenues in emerging markets and in
currency options, and improved results in
government bond trading. These were offset by
weaker revenues in debt securities trading across
all major regions. These declined against a
backdrop of widening credit spreads on corporate
debt securities following the widely publicised
accounting scandals across the US, and concerns
about a slowdown in global economic growth.
Interest rate derivatives undertaken to hedge
the interest rate risk arising on holding of corporate
bonds generated dealing losses, although this was
offset by increased net interest income on the
bonds.
In the UK, increased activity in equity swap
transactions generated dealing losses which were
offset by significantly increased dividend income.
Other income increased by US$42 million or 7
per cent due to improvements in North America
together with higher income from Rail Finance.
Outside the major centres, there were strong
results from Singapore, India, China and Japan.
Operating expenses were in line with 2001.
Whilst there were significant reductions in staff
costs in Investment Banking as staff numbers were
reduced in the light of market conditions, these
were offset by increased revenue related costs in
Treasury and Capital Markets.
Provisions for bad and doubtful debts
increased by US$150 million due to lower levels of
provision release compared to 2001, which had
included a significant recovery relating to an
historic Olympia and York exposure. Provisioning
in 2002 was dominated by a small number of
telecommunications related exposures in the UK
and Canada.
Amounts written off fixed asset investments
increased by US$37 million or 51 per cent
reflecting the writedown of a limited number of
venture capital investments across the Group.
Gains on disposal of investments and tangible
fixed assets decreased by US$37 million or 10 per
cent.
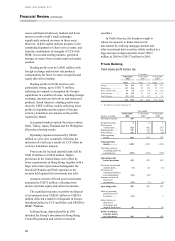
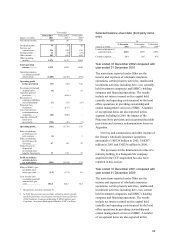
Year ended 31 December 2001 compared with
year ended 31 December 2000
Corporate, Investment Banking and Markets
contributed US$4,033 million of pre-tax profits in
2001 representing 45.8 per cent of such profits.
Compared with 2000, pre-tax profits were US$474
million higher, an increase of 13 per cent, driven
by lower bad debt charges and a substantial
increase in net interest income in the markets
business in the falling interest rate environment.
Net interest income increased by US$570
million or 20 per cent. The increase reflected a
number of factors; money market income was
strong, as treasury was positioned to take
advantage of falling rates, treasury also improved
its yield by shifting part of its holding of liquid
assets from government bonds to high quality
corporate bonds. Increased equity swap activity
generated additional cash deposits and in a number
of emerging markets, notably Turkey, treasury
operations benefited from high interest rates and
volatile market conditions in 2001.
Net fees and commissions declined by US$165
million or 7 per cent on the year. A year of severely
adverse conditions in global new equity