HSBC 2002 Annual Report Download - page 205
Download and view the complete annual report
Please find page 205 of the 2002 HSBC annual report below. You can navigate through the pages in the report by either clicking on the pages listed below, or by using the keyword search tool below to find specific information within the annual report.-
 1
1 -
2
-
3
-
4
-
5
-
6
-
7
-
8
-
9
-
10
-
11
-
12
-
13
-
14
-
15
-
16
-
17
-
18
-
19
-
20
-
21
-
22
-
23
-
24
-
25
-
26
-
27
-
28
-
29
-
30
-
31
-
32
-
33
-
34
-
35
-
36
-
37
-
38
-
39
-
40
-
41
-
42
-
43
-
44
-
45
-
46
-
47
-
48
-
49
-
50
-
51
-
52
-
53
-
54
-
55
-
56
-
57
-
58
-
59
-
60
-
61
-
62
-
63
-
64
-
65
-
66
-
67
-
68
-
69
-
70
-
71
-
72
-
73
-
74
-
75
-
76
-
77
-
78
-
79
-
80
-
81
-
82
-
83
-
84
-
85
-
86
-
87
-
88
-
89
-
90
-
91
-
92
-
93
-
94
-
95
-
96
-
97
-
98
-
99
-
100
-
101
-
102
-
103
-
104
-
105
-
106
-
107
-
108
-
109
-
110
-
111
-
112
-
113
-
114
-
115
-
116
-
117
-
118
-
119
-
120
-
121
-
122
-
123
-
124
-
125
-
126
-
127
-
128
-
129
-
130
-
131
-
132
-
133
-
134
-
135
-
136
-
137
-
138
-
139
-
140
-
141
-
142
-
143
-
144
-
145
-
146
-
147
-
148
-
149
-
150
-
151
-
152
-
153
-
154
-
155
-
156
-
157
-
158
-
159
-
160
-
161
-
162
-
163
-
164
-
165
-
166
-
167
-
168
-
169
-
170
-
171
-
172
-
173
-
174
-
175
-
176
-
177
-
178
-
179
-
180
-
181
-
182
-
183
-
184
-
185
-
186
-
187
-
188
-
189
-
190
-
191
-
192
-
193
-
194
-
 195
195 -
 196
196 -
 197
197 -
 198
198 -
 199
199 -
 200
200 -
 201
201 -
 202
202 -
 203
203 -
 204
204 -
 205
205 -
 206
206 -
 207
207 -
 208
208 -
 209
209 -
 210
210 -
 211
211 -
 212
212 -
 213
213 -
 214
214 -
 215
215 -
216
-
217
-
218
-
219
-
220
-
221
-
222
-
223
-
224
-
225
-
226
-
227
-
228
-
229
-
230
-
231
-
232
-
233
-
234
-
235
-
236
-
237
-
238
-
239
-
240
-
241
-
242
-
243
-
244
-
245
-
246
-
247
-
248
-
249
-
250
-
251
-
252
-
253
-
254
-
255
-
256
-
257
-
258
-
259
-
260
-
261
-
262
-
263
-
264
-
265
-
266
-
267
-
268
-
269
-
270
-
271
-
272
-
273
-
274
-
275
-
276
-
277
-
278
-
279
-
280
-
281
-
282
-
283
-
284
-
285
-
286
-
287
-
288
-
289
-
290
-
291
-
292
-
293
-
294
-
295
-
296
-
297
-
298
-
299
-
300
-
301
-
302
-
303
-
304
-
305
-
306
-
307
-
308
-
309
-
310
-
311
-
312
-
313
-
314
-
315
-
316
-
317
-
318
-
319
-
320
-
321
-
322
-
323
-
324
-
325
-
326
-
327
-
328
-
329
 |
 |

203
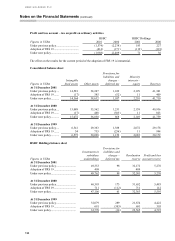
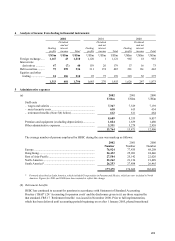
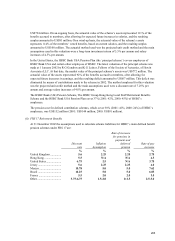
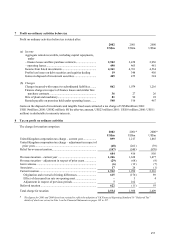
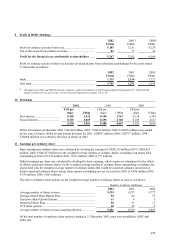
4 Analysis of income from dealing in financial instruments
2002 2001 2000
D
ealin
g
profits
D
ividen
d
and ne
t
interest
income Tota
l
D
ealin
g
profits
D
ividen
d
and ne
t
interest
income Tota
l
D
ealin
g
profits
D
ividen
d
and ne
t
interes
t
income Tota
l
US$m US$m US$m US$m US$m US$m US$m US$m US$m
Foreign exchange..... 1,167 43 1,210 1,120 1 1,121 965 18 983
Interest rate
derivatives ............ 47 (7 ) 40 159 20 179 57 16 73
Debt securities.......... 75 259 334 311 174 485 281 161 442
Equities and other
trading .................. 24 186 210 95 75 170 323 52 375
1,313 481 1,794 1,685 270 1,955 1,626 247 1,873
5 Administrative expenses
(a) 2002 2001 2000
US$m US$m US$m
Staff costs
– wages and salaries .............................................................. 7,367 7,329 7,139
– social security costs............................................................ 630 613 454
– retirement benefits (Note 5(b) below) ................................ 612 611 464
8,609 8,553 8,057
Premises and equipment (excluding depreciation)................. 1,824 1,639 1,480
Other administrative expenses ............................................... 3,331 3,279 2,959
13,764 13,471 12,496
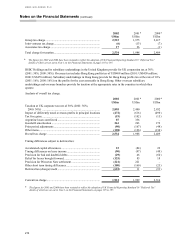
The average number of persons employed by HSBC during the year was made up as follows:
2002 2001 2000
Number Number Number
Europe.................................................................................... 76,924 77,435 68,208
Hong Kong............................................................................. 24,452 25,081 24,446
Rest of Asia-Pacific ............................................................... 27,584 25,142 22,020
North America ....................................................................... 22,262 21,136 21,489
South America* ..................................................................... 26,253 27,888 26,465
177,475 176,682 162,628
* Formerly described as Latin America, which included Group entities in Panama and Mexico, which are now included in North
America. Figures for 2001 and 2000 have been restated to reflect this change
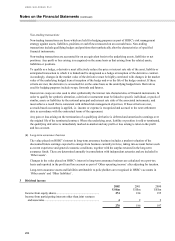
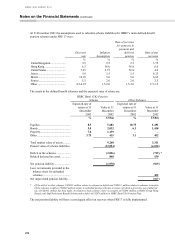
(b) Retirement benefits
HSBC has continued to account for pensions in accordance with Statement of Standard Accounting
Practice (‘SSAP’ ) 24 ‘Accounting for pension costs’ and the disclosures given in (i) are those required by
that standard. FRS 17 ‘Retirement benefits’ was issued in November 2000. Prior to full implementation,
which has been deferred until accounting periods beginning on or after 1 January 2005, phased transitional