HSBC 2002 Annual Report Download - page 307
Download and view the complete annual report
Please find page 307 of the 2002 HSBC annual report below. You can navigate through the pages in the report by either clicking on the pages listed below, or by using the keyword search tool below to find specific information within the annual report.-
 1
1 -
2
-
3
-
4
-
5
-
6
-
7
-
8
-
9
-
10
-
11
-
12
-
13
-
14
-
15
-
16
-
17
-
18
-
19
-
20
-
21
-
22
-
23
-
24
-
25
-
26
-
27
-
28
-
29
-
30
-
31
-
32
-
33
-
34
-
35
-
36
-
37
-
38
-
39
-
40
-
41
-
42
-
43
-
44
-
45
-
46
-
47
-
48
-
49
-
50
-
51
-
52
-
53
-
54
-
55
-
56
-
57
-
58
-
59
-
60
-
61
-
62
-
63
-
64
-
65
-
66
-
67
-
68
-
69
-
70
-
71
-
72
-
73
-
74
-
75
-
76
-
77
-
78
-
79
-
80
-
81
-
82
-
83
-
84
-
85
-
86
-
87
-
88
-
89
-
90
-
91
-
92
-
93
-
94
-
95
-
96
-
97
-
98
-
99
-
100
-
101
-
102
-
103
-
104
-
105
-
106
-
107
-
108
-
109
-
110
-
111
-
112
-
113
-
114
-
115
-
116
-
117
-
118
-
119
-
120
-
121
-
122
-
123
-
124
-
125
-
126
-
127
-
128
-
129
-
130
-
131
-
132
-
133
-
134
-
135
-
136
-
137
-
138
-
139
-
140
-
141
-
142
-
143
-
144
-
145
-
146
-
147
-
148
-
149
-
150
-
151
-
152
-
153
-
154
-
155
-
156
-
157
-
158
-
159
-
160
-
161
-
162
-
163
-
164
-
165
-
166
-
167
-
168
-
169
-
170
-
171
-
172
-
173
-
174
-
175
-
176
-
177
-
178
-
179
-
180
-
181
-
182
-
183
-
184
-
185
-
186
-
187
-
188
-
189
-
190
-
191
-
192
-
193
-
194
-
195
-
196
-
197
-
198
-
199
-
200
-
201
-
202
-
203
-
204
-
205
-
206
-
207
-
208
-
209
-
210
-
211
-
212
-
213
-
214
-
215
-
216
-
217
-
218
-
219
-
220
-
221
-
222
-
223
-
224
-
225
-
226
-
227
-
228
-
229
-
230
-
231
-
232
-
233
-
234
-
235
-
236
-
237
-
238
-
239
-
240
-
241
-
242
-
243
-
244
-
245
-
246
-
247
-
248
-
249
-
250
-
251
-
252
-
253
-
254
-
255
-
256
-
257
-
258
-
259
-
260
-
261
-
262
-
263
-
264
-
265
-
266
-
267
-
268
-
269
-
270
-
271
-
272
-
273
-
274
-
275
-
276
-
277
-
278
-
279
-
280
-
281
-
282
-
283
-
284
-
285
-
286
-
287
-
288
-
289
-
290
-
291
-
292
-
293
-
294
-
295
-
296
-
 297
297 -
 298
298 -
 299
299 -
 300
300 -
 301
301 -
 302
302 -
 303
303 -
 304
304 -
 305
305 -
 306
306 -
 307
307 -
 308
308 -
 309
309 -
 310
310 -
 311
311 -
 312
312 -
 313
313 -
 314
314 -
 315
315 -
 316
316 -
 317
317 -
318
-
319
-
320
-
321
-
322
-
323
-
324
-
325
-
326
-
327
-
328
-
329
 |
 |

305
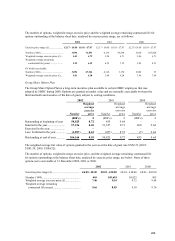
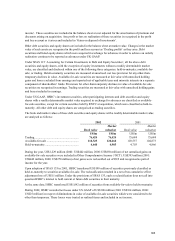
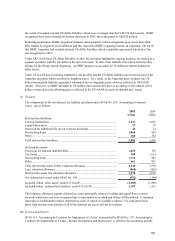
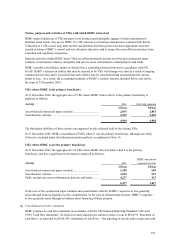
income’ . These securities are included in the balance sheet at cost adjusted for the amortisation of premium and
discounts arising on acquisition. Any profit or loss on realisation of these securities is recognised in the profit
and loss account as it arises and included in ‘Gains on disposal of investments’ .
Other debt securities and equity shares are included in the balance sheet at market value. Changes in the market
value of such assets are recognised in the profit and loss account as ‘Dealing profits’ as they arise. Debt
securities and listed equity shares which were acquired in exchange for advances in order to achieve an orderly
realisation continue to be reported as advances under UK GAAP.
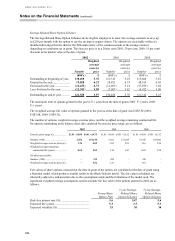
Under SFAS 115 ‘Accounting for Certain Investments in Debt and Equity Securities’ , all the above debt
securities and equity shares, with the exception of equity investments without a readily determinable market
value, are classified and disclosed within one of the following three categories: held-to-maturity; available-for-
sale; or trading. Held-to-maturity securities are measured at amortised cost less provision for any other-than-
temporary declines in value. Available-for-sale securities are measured at fair value with unrealised holding
gains and losses excluded from earnings and reported net of applicable taxes and minority interests in a separate
component of shareholders’ funds. Provisions for other-than-temporary declines in value of available-for-sale
securities are recognised in earnings. Trading securities are measured at fair value with unrealised holding gains
and losses included in earnings.
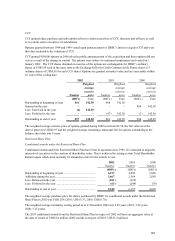
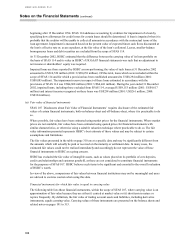
Under US GAAP, HSBC’ s investment securities, other participating interests and debt securities and equity
shares with a readily determinable market value acquired in exchange for advances are classified as available-
for-sale securities, except for certain securities held by RNYC at acquisition, which were classified as held-to-
maturity. All other debt and equity shares are categorised as trading securities.
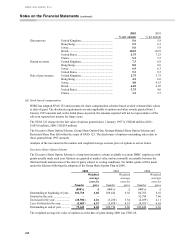
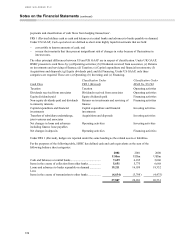
The book and market values of these debt securities and equity shares with a readily determinable market value
are analysed as follows:
2002 2001
Book value Marke
t
valuation Book value
M
arke
t
valuation
US$m US$m US$m US$m
Trading............................................................. 76,424 76,424 75,684 75,684
Available-for-sale ............................................ 118,325 120,468 103,557 104,873
Held-to-maturity .............................................. 4,648 4,905 4,703 4,866
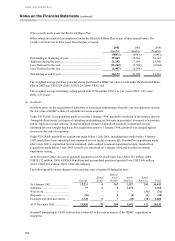
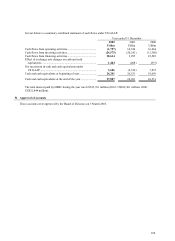
During the year, US$1,229 million (2001: US$442 million, 2000: US$850 million) of net unrealised gains on
available-for-sale securities were included in Other Comprehensive Income (‘OCI’ ). US$393 million (2001:
US$442 million, 2000: US$270 million) of net gains were reclassified out of OCI and recognised as part of
income for the year.
Upon adoption of SFAS 133 in 2001, HSBC transferred US$190 million of securities previously classified as
held-to-maturity to securities available-for-sale. The reclassification resulted in a net of tax cumulative effect
adjustment loss of US$11 million. Under the provisions of SFAS 133, such a reclassification does not call into
question HSBC’ s interest to hold current or future debt securities to their maturity.
At the same date, HSBC transferred US$1,042 million of securities from available-for-sale to held-to-maturity.
During 2002, HSBC recorded net losses under US GAAP of US$308 million (2001 US$104 million; 2000:
US$25 million) in respect of diminutions in value of available-for-sale securities which were considered to be
other than temporary. These losses were treated as realised items and included in net income.