HSBC 2002 Annual Report Download - page 211
Download and view the complete annual report
Please find page 211 of the 2002 HSBC annual report below. You can navigate through the pages in the report by either clicking on the pages listed below, or by using the keyword search tool below to find specific information within the annual report.-
 1
1 -
2
-
3
-
4
-
5
-
6
-
7
-
8
-
9
-
10
-
11
-
12
-
13
-
14
-
15
-
16
-
17
-
18
-
19
-
20
-
21
-
22
-
23
-
24
-
25
-
26
-
27
-
28
-
29
-
30
-
31
-
32
-
33
-
34
-
35
-
36
-
37
-
38
-
39
-
40
-
41
-
42
-
43
-
44
-
45
-
46
-
47
-
48
-
49
-
50
-
51
-
52
-
53
-
54
-
55
-
56
-
57
-
58
-
59
-
60
-
61
-
62
-
63
-
64
-
65
-
66
-
67
-
68
-
69
-
70
-
71
-
72
-
73
-
74
-
75
-
76
-
77
-
78
-
79
-
80
-
81
-
82
-
83
-
84
-
85
-
86
-
87
-
88
-
89
-
90
-
91
-
92
-
93
-
94
-
95
-
96
-
97
-
98
-
99
-
100
-
101
-
102
-
103
-
104
-
105
-
106
-
107
-
108
-
109
-
110
-
111
-
112
-
113
-
114
-
115
-
116
-
117
-
118
-
119
-
120
-
121
-
122
-
123
-
124
-
125
-
126
-
127
-
128
-
129
-
130
-
131
-
132
-
133
-
134
-
135
-
136
-
137
-
138
-
139
-
140
-
141
-
142
-
143
-
144
-
145
-
146
-
147
-
148
-
149
-
150
-
151
-
152
-
153
-
154
-
155
-
156
-
157
-
158
-
159
-
160
-
161
-
162
-
163
-
164
-
165
-
166
-
167
-
168
-
169
-
170
-
171
-
172
-
173
-
174
-
175
-
176
-
177
-
178
-
179
-
180
-
181
-
182
-
183
-
184
-
185
-
186
-
187
-
188
-
189
-
190
-
191
-
192
-
193
-
194
-
195
-
196
-
197
-
198
-
199
-
200
-
 201
201 -
 202
202 -
 203
203 -
 204
204 -
 205
205 -
 206
206 -
 207
207 -
 208
208 -
 209
209 -
 210
210 -
 211
211 -
 212
212 -
 213
213 -
 214
214 -
 215
215 -
 216
216 -
 217
217 -
 218
218 -
 219
219 -
 220
220 -
 221
221 -
222
-
223
-
224
-
225
-
226
-
227
-
228
-
229
-
230
-
231
-
232
-
233
-
234
-
235
-
236
-
237
-
238
-
239
-
240
-
241
-
242
-
243
-
244
-
245
-
246
-
247
-
248
-
249
-
250
-
251
-
252
-
253
-
254
-
255
-
256
-
257
-
258
-
259
-
260
-
261
-
262
-
263
-
264
-
265
-
266
-
267
-
268
-
269
-
270
-
271
-
272
-
273
-
274
-
275
-
276
-
277
-
278
-
279
-
280
-
281
-
282
-
283
-
284
-
285
-
286
-
287
-
288
-
289
-
290
-
291
-
292
-
293
-
294
-
295
-
296
-
297
-
298
-
299
-
300
-
301
-
302
-
303
-
304
-
305
-
306
-
307
-
308
-
309
-
310
-
311
-
312
-
313
-
314
-
315
-
316
-
317
-
318
-
319
-
320
-
321
-
322
-
323
-
324
-
325
-
326
-
327
-
328
-
329
 |
 |

209
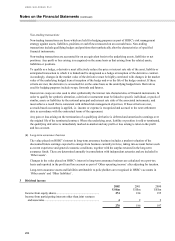
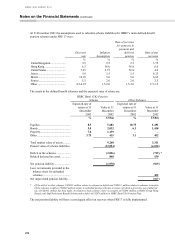
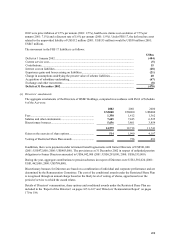
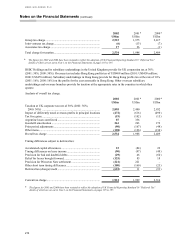
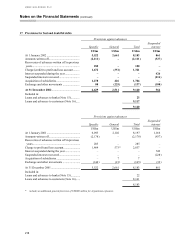
2002 were price inflation of 2.5% per annum (2001: 2.5%), health-care claims cost escalation of 7.5% per
annum (2001: 7.5%) and a discount rate of 5.6% per annum (2001: 5.9%). Under FRS 17, the deferred tax asset
related to the unprovided liability of US$112 million (2001: US$135 million) would be US$38 million (2001:
US$47 million).
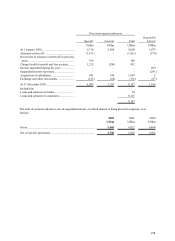
The movement in the FRS 17 liability is as follows:
US$m
Deficit at 1 January 2002 ........................................................................................................... (404)
Current service cost.................................................................................................................... (5)
Contributions.............................................................................................................................. 15
Interest cost on liabilities............................................................................................................ (28)
Experience gains and losses arising on liabilities....................................................................... (21)
Change in assumptions underlying the present value of scheme liabilities................................ 40
Acquisition of subsidiary undertaking........................................................................................ (67)
Exchange and other movements................................................................................................. (8 )
Deficit at 31 December 2002.................................................................................................... (478)
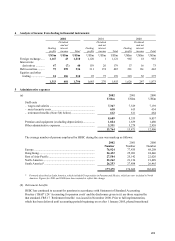
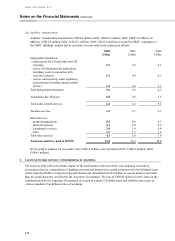
(c) Directors’ emoluments
The aggregate emoluments of the Directors of HSBC Holdings, computed in accordance with Part I of Schedule
6 of the Act were:
2002 2001 2000
US$000 US$000 US$000
Fees....................................................................................... 1,338 1,412 1,362
Salaries and other emoluments ............................................. 7,605 7,445 6,525
Discretionary bonuses........................................................... 5,636 3,861 3,854
14,579 12,718 11,741
Gains on the exercise of share options.................................. 514 1,990 4,187
Vesting of Restricted Share Plan awards ..............................
–
756 491
In addition, there were payments under retirement benefit agreements with former Directors of US$501,000
(2001: US$472,000; 2000: US$483,000). The provision as at 31 December 2002 in respect of unfunded pension
obligations to former Directors amounted to US$6,942,000 (2001: US$6,281,000; 2000: US$6,535,000).
During the year, aggregate contributions to pension schemes in respect of Directors were US$1,592,024 (2001:
US$1,462,000; 2000: US$798,000).
Discretionary bonuses for Directors are based on a combination of individual and corporate performance and are
determined by the Remuneration Committee. The cost of the conditional awards under the Restricted Share Plan
is recognised through an annual charge based on the likely level of vesting of shares, apportioned over the
period of service to which the award relates.
Details of Directors’ remuneration, share options and conditional awards under the Restricted Share Plan are
included in the ‘Report of the Directors’ on pages 165 to 167 and ‘Directors’ Remuneration Report’ on pages
170 to 186.