HSBC 2002 Annual Report Download - page 5
Download and view the complete annual report
Please find page 5 of the 2002 HSBC annual report below. You can navigate through the pages in the report by either clicking on the pages listed below, or by using the keyword search tool below to find specific information within the annual report.-
 1
1 -
 2
2 -
 3
3 -
 4
4 -
 5
5 -
 6
6 -
 7
7 -
 8
8 -
 9
9 -
 10
10 -
 11
11 -
 12
12 -
 13
13 -
 14
14 -
 15
15 -
 16
16 -
17
-
18
-
19
-
20
-
21
-
22
-
23
-
24
-
25
-
26
-
27
-
28
-
29
-
30
-
31
-
32
-
33
-
34
-
35
-
36
-
37
-
38
-
39
-
40
-
41
-
42
-
43
-
44
-
45
-
46
-
47
-
48
-
49
-
50
-
51
-
52
-
53
-
54
-
55
-
56
-
57
-
58
-
59
-
60
-
61
-
62
-
63
-
64
-
65
-
66
-
67
-
68
-
69
-
70
-
71
-
72
-
73
-
74
-
75
-
76
-
77
-
78
-
79
-
80
-
81
-
82
-
83
-
84
-
85
-
86
-
87
-
88
-
89
-
90
-
91
-
92
-
93
-
94
-
95
-
96
-
97
-
98
-
99
-
100
-
101
-
102
-
103
-
104
-
105
-
106
-
107
-
108
-
109
-
110
-
111
-
112
-
113
-
114
-
115
-
116
-
117
-
118
-
119
-
120
-
121
-
122
-
123
-
124
-
125
-
126
-
127
-
128
-
129
-
130
-
131
-
132
-
133
-
134
-
135
-
136
-
137
-
138
-
139
-
140
-
141
-
142
-
143
-
144
-
145
-
146
-
147
-
148
-
149
-
150
-
151
-
152
-
153
-
154
-
155
-
156
-
157
-
158
-
159
-
160
-
161
-
162
-
163
-
164
-
165
-
166
-
167
-
168
-
169
-
170
-
171
-
172
-
173
-
174
-
175
-
176
-
177
-
178
-
179
-
180
-
181
-
182
-
183
-
184
-
185
-
186
-
187
-
188
-
189
-
190
-
191
-
192
-
193
-
194
-
195
-
196
-
197
-
198
-
199
-
200
-
201
-
202
-
203
-
204
-
205
-
206
-
207
-
208
-
209
-
210
-
211
-
212
-
213
-
214
-
215
-
216
-
217
-
218
-
219
-
220
-
221
-
222
-
223
-
224
-
225
-
226
-
227
-
228
-
229
-
230
-
231
-
232
-
233
-
234
-
235
-
236
-
237
-
238
-
239
-
240
-
241
-
242
-
243
-
244
-
245
-
246
-
247
-
248
-
249
-
250
-
251
-
252
-
253
-
254
-
255
-
256
-
257
-
258
-
259
-
260
-
261
-
262
-
263
-
264
-
265
-
266
-
267
-
268
-
269
-
270
-
271
-
272
-
273
-
274
-
275
-
276
-
277
-
278
-
279
-
280
-
281
-
282
-
283
-
284
-
285
-
286
-
287
-
288
-
289
-
290
-
291
-
292
-
293
-
294
-
295
-
296
-
297
-
298
-
299
-
300
-
301
-
302
-
303
-
304
-
305
-
306
-
307
-
308
-
309
-
310
-
311
-
312
-
313
-
314
-
315
-
316
-
317
-
318
-
319
-
320
-
321
-
322
-
323
-
324
-
325
-
326
-
327
-
328
-
329
 |
 |

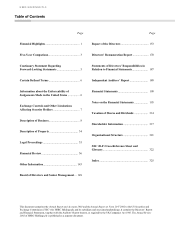
HSBC HOLDINGS PLC
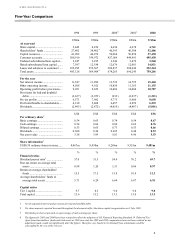
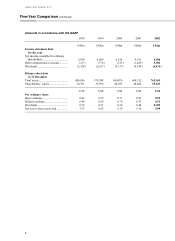
Five-Year Comparison
3
1998 1999 20004200142002
US$m US$m US$m US$m US$m
At year-end
Share capital...................................... 3,443 4,230 4,634 4,678 4,741
Shareholders’ funds .......................... 27,402 34,402446,393 46,388 52,406
Capital resources............................... 41,092 44,270 50,964 50,854 57,430
Customer accounts............................ 308,910 359,972 427,069 449,991 495,438
Undated subordinated loan capital.... 3,247 3,235 3,546 3,479 3,540
Dated subordinated loan capital........ 7,597 12,188 12,676 12,001 14,831
Loans and advances to customers1.... 235,295 253,567 289,837 308,649 352,344
Total assets........................................ 483,128 569,9084674,265 696,245 759,246
For the year
Net interest income ........................... 11,547 11,990 13,723 14,725 15,460
Other operating income..................... 8,508 9,012 10,850 11,163 11,135
Operating profit before provisions.... 9,051 9,653 10,486 10,484 10,787
Provisions for bad and doubtful
debts .............................................. (2,637) (2,073) (932) (2,037) (1,321)
Pre-tax profits ................................... 6,571 7,982 9,775 8,000 9,650
Profit attributable to shareholders ..... 4,318 5,408 6,457 4,992 6,239
Dividends.......................................... (2,495) (2,872) (4,010) (4,467) (5,001)
US$US$US$US$ US$
Per ordinary share2
Basic earnings................................... 0.54 0.65 0.74 0.54 0.67
Cash earnings.................................... 0.54 0.66 0.80 0.63 0.76
Diluted earnings................................ 0.53 0.65 0.73 0.53 0.66
Dividends.......................................... 0.308 0.34 0.435 0.48 0.53
Net asset value ................................. 3.38 3.95 5.01 4.96 5.53
Share information2
US$0.50 ordinary shares in issue...... 8,067m 8,458m 9,268m 9,355m 9,481m
%%%%%
Financial ratios
Dividend payout ratio3...................... 57.0 51.5 54.4 76.2 69.7
Post-tax return on average total
assets ............................................. 0.98 1.20 1.31 0.86 0.97
Return on average shareholders’
funds.............................................. 15.5 17.5 15.8 10.4 12.3
Average shareholders’ funds to
average total assets ........................ 5.71 6.24 6.64 6.87 6.91
Capital ratios
Tier 1 capital..................................... 9.7 8.5 9.0 9.0 9.0
Total capital ...................................... 13.6 13.2 13.3 13.0 13.3
1Net of suspended interest and provisions for bad and doubtful debts.
2Per share amounts reported here and throughout the document reflect the share capital reorganisation on 2 July 1999.
3Dividends per share expressed as a percentage of cash earnings per share.
4The figures for 2001 and 2000 have been restated to reflect the adoption of UK Financial Reporting Standard 19 ‘Deferred Tax’.
Apart from shareholders’ funds and total assets at 1999 year-end, the 1999 and 1998 comparatives have not been restated as any
adjustment made would not significantly alter the figures. Therefore, any benefit to be obtained from restatement would be
outweighed by the cost of the exercise.