HSBC 2002 Annual Report Download - page 91
Download and view the complete annual report
Please find page 91 of the 2002 HSBC annual report below. You can navigate through the pages in the report by either clicking on the pages listed below, or by using the keyword search tool below to find specific information within the annual report.-
 1
1 -
2
-
3
-
4
-
5
-
6
-
7
-
8
-
9
-
10
-
11
-
12
-
13
-
14
-
15
-
16
-
17
-
18
-
19
-
20
-
21
-
22
-
23
-
24
-
25
-
26
-
27
-
28
-
29
-
30
-
31
-
32
-
33
-
34
-
35
-
36
-
37
-
38
-
39
-
40
-
41
-
42
-
43
-
44
-
45
-
46
-
47
-
48
-
49
-
50
-
51
-
52
-
53
-
54
-
55
-
56
-
57
-
58
-
59
-
60
-
61
-
62
-
63
-
64
-
65
-
66
-
67
-
68
-
69
-
70
-
71
-
72
-
73
-
74
-
75
-
76
-
77
-
78
-
79
-
80
-
 81
81 -
 82
82 -
 83
83 -
 84
84 -
 85
85 -
 86
86 -
 87
87 -
 88
88 -
 89
89 -
 90
90 -
 91
91 -
 92
92 -
 93
93 -
 94
94 -
 95
95 -
 96
96 -
 97
97 -
 98
98 -
 99
99 -
 100
100 -
 101
101 -
102
-
103
-
104
-
105
-
106
-
107
-
108
-
109
-
110
-
111
-
112
-
113
-
114
-
115
-
116
-
117
-
118
-
119
-
120
-
121
-
122
-
123
-
124
-
125
-
126
-
127
-
128
-
129
-
130
-
131
-
132
-
133
-
134
-
135
-
136
-
137
-
138
-
139
-
140
-
141
-
142
-
143
-
144
-
145
-
146
-
147
-
148
-
149
-
150
-
151
-
152
-
153
-
154
-
155
-
156
-
157
-
158
-
159
-
160
-
161
-
162
-
163
-
164
-
165
-
166
-
167
-
168
-
169
-
170
-
171
-
172
-
173
-
174
-
175
-
176
-
177
-
178
-
179
-
180
-
181
-
182
-
183
-
184
-
185
-
186
-
187
-
188
-
189
-
190
-
191
-
192
-
193
-
194
-
195
-
196
-
197
-
198
-
199
-
200
-
201
-
202
-
203
-
204
-
205
-
206
-
207
-
208
-
209
-
210
-
211
-
212
-
213
-
214
-
215
-
216
-
217
-
218
-
219
-
220
-
221
-
222
-
223
-
224
-
225
-
226
-
227
-
228
-
229
-
230
-
231
-
232
-
233
-
234
-
235
-
236
-
237
-
238
-
239
-
240
-
241
-
242
-
243
-
244
-
245
-
246
-
247
-
248
-
249
-
250
-
251
-
252
-
253
-
254
-
255
-
256
-
257
-
258
-
259
-
260
-
261
-
262
-
263
-
264
-
265
-
266
-
267
-
268
-
269
-
270
-
271
-
272
-
273
-
274
-
275
-
276
-
277
-
278
-
279
-
280
-
281
-
282
-
283
-
284
-
285
-
286
-
287
-
288
-
289
-
290
-
291
-
292
-
293
-
294
-
295
-
296
-
297
-
298
-
299
-
300
-
301
-
302
-
303
-
304
-
305
-
306
-
307
-
308
-
309
-
310
-
311
-
312
-
313
-
314
-
315
-
316
-
317
-
318
-
319
-
320
-
321
-
322
-
323
-
324
-
325
-
326
-
327
-
328
-
329
 |
 |
89
Liability businesses, with a particular emphasis on
the Current Account market. The Commercial
market is highly competitive and the Government
proposals are aimed at increasing customer
switching between players. Approximately fifty per
cent of HSBC’s Commercial income is now subject
to Government price controls and the cost of
implementing these pricing adjustments is
estimated to be US$130 million per annum.
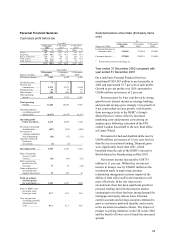
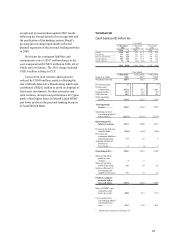
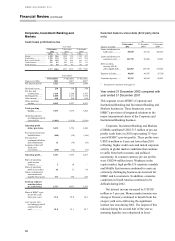
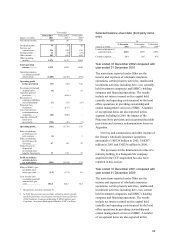
Year ended 31 December 2001 compared with
year ended 31 December 2000
The Commercial Banking line of business
contributed US$2,385 million to pre-tax profits in
2001 and represented 27.1 per cent of such profits.
Pre-tax profits were US$395 million lower, a
decline of 14 per cent reflecting higher net
provisions for bad and doubtful debts as recoveries
fell and the impact of the release of the Asian
special general provision in 2000 was not repeated.
Operating profits before provisions were up
slightly, by US$51 million or 2 per cent.
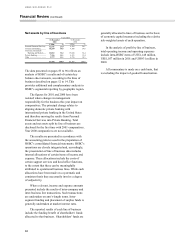
Net interest income increased by US$280
million or 8 per cent. Net interest income in Europe
rose by US$254 million, mainly reflecting the
inclusion of a full year’ s income for CCF in 2001.
Excluding the impact of CCF, net interest income
in Europe was down slightly, mainly due to foreign
exchange movements. Underlying net interest
income in the UK was broadly unchanged, as
significant growth in UK commercial loans and
deposits was offset by falling margins due to lower
base rates and increased competitive pressures. Net
interest income in Hong Kong fell slightly, by
US$44 million, due to lower margins on current
account deposits. The rest of Asia-Pacific saw a
small rise in net interest income as the benefit of
lower funding costs in the Middle East offset lower
margins in Singapore.
North America saw strong growth in net
interest income, which rose by US$97 million
reflecting organic growth, increased commercial
deposit levels and improved margins in
commercial real estate lending.
Net fees and commissions rose by US$70
million or 4 per cent against 2000. The main part of
this rise was in Europe, again mainly reflecting the
impact of including a full year of results for CCF.
Fees in the UK were broadly flat in constant
currency terms.
Operating expenses increased by US$378
million or 14 per cent, within which US$227
million reflected a rise in staff costs and US$64
million increased premises and equipment. Again,
the inclusion of a full impact for CCF was the main
contributor.
Provisions for bad and doubtful debts rose
sharply from US$202 million to US$662 million.
Of the increase in Europe (up by US$171 million),
US$60 million related to CCF, with the remainder
mainly reflecting higher provisions in the UK due
to the less favourable economic environment and
pressures on UK manufacturing industry.
Provisions in the rest of Asia-Pacific rose by
US$123 million, notably due to further charges in
Indonesia and the non-recurrence of the benefit
seen in 2000 from the release of the special general
provision.
In North America provisions rose by US$86
million, reflecting losses in receivables lending and
equipment lending. Canada also experienced
increased loan losses, particularly to one name in
the telecommunications sector. South American
loan losses rose by US$79 million, including
US$58 million in Argentina, with increased losses
in Brazil.