HSBC 2002 Annual Report Download - page 105
Download and view the complete annual report
Please find page 105 of the 2002 HSBC annual report below. You can navigate through the pages in the report by either clicking on the pages listed below, or by using the keyword search tool below to find specific information within the annual report.-
 1
1 -
2
-
3
-
4
-
5
-
6
-
7
-
8
-
9
-
10
-
11
-
12
-
13
-
14
-
15
-
16
-
17
-
18
-
19
-
20
-
21
-
22
-
23
-
24
-
25
-
26
-
27
-
28
-
29
-
30
-
31
-
32
-
33
-
34
-
35
-
36
-
37
-
38
-
39
-
40
-
41
-
42
-
43
-
44
-
45
-
46
-
47
-
48
-
49
-
50
-
51
-
52
-
53
-
54
-
55
-
56
-
57
-
58
-
59
-
60
-
61
-
62
-
63
-
64
-
65
-
66
-
67
-
68
-
69
-
70
-
71
-
72
-
73
-
74
-
75
-
76
-
77
-
78
-
79
-
80
-
81
-
82
-
83
-
84
-
85
-
86
-
87
-
88
-
89
-
90
-
91
-
92
-
93
-
94
-
 95
95 -
 96
96 -
 97
97 -
 98
98 -
 99
99 -
 100
100 -
 101
101 -
 102
102 -
 103
103 -
 104
104 -
 105
105 -
 106
106 -
 107
107 -
 108
108 -
 109
109 -
 110
110 -
 111
111 -
 112
112 -
 113
113 -
 114
114 -
 115
115 -
116
-
117
-
118
-
119
-
120
-
121
-
122
-
123
-
124
-
125
-
126
-
127
-
128
-
129
-
130
-
131
-
132
-
133
-
134
-
135
-
136
-
137
-
138
-
139
-
140
-
141
-
142
-
143
-
144
-
145
-
146
-
147
-
148
-
149
-
150
-
151
-
152
-
153
-
154
-
155
-
156
-
157
-
158
-
159
-
160
-
161
-
162
-
163
-
164
-
165
-
166
-
167
-
168
-
169
-
170
-
171
-
172
-
173
-
174
-
175
-
176
-
177
-
178
-
179
-
180
-
181
-
182
-
183
-
184
-
185
-
186
-
187
-
188
-
189
-
190
-
191
-
192
-
193
-
194
-
195
-
196
-
197
-
198
-
199
-
200
-
201
-
202
-
203
-
204
-
205
-
206
-
207
-
208
-
209
-
210
-
211
-
212
-
213
-
214
-
215
-
216
-
217
-
218
-
219
-
220
-
221
-
222
-
223
-
224
-
225
-
226
-
227
-
228
-
229
-
230
-
231
-
232
-
233
-
234
-
235
-
236
-
237
-
238
-
239
-
240
-
241
-
242
-
243
-
244
-
245
-
246
-
247
-
248
-
249
-
250
-
251
-
252
-
253
-
254
-
255
-
256
-
257
-
258
-
259
-
260
-
261
-
262
-
263
-
264
-
265
-
266
-
267
-
268
-
269
-
270
-
271
-
272
-
273
-
274
-
275
-
276
-
277
-
278
-
279
-
280
-
281
-
282
-
283
-
284
-
285
-
286
-
287
-
288
-
289
-
290
-
291
-
292
-
293
-
294
-
295
-
296
-
297
-
298
-
299
-
300
-
301
-
302
-
303
-
304
-
305
-
306
-
307
-
308
-
309
-
310
-
311
-
312
-
313
-
314
-
315
-
316
-
317
-
318
-
319
-
320
-
321
-
322
-
323
-
324
-
325
-
326
-
327
-
328
-
329
 |
 |

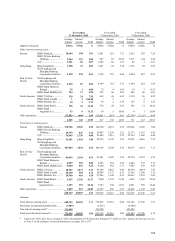
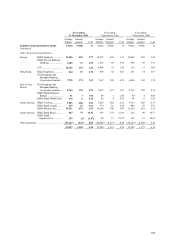
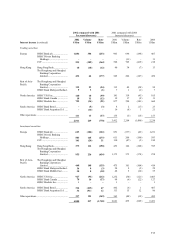
103
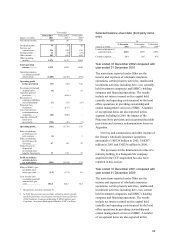
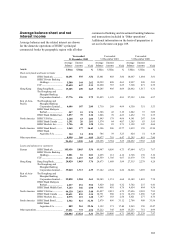
Year ended
31 December 2002
Year ended
31 December 2001
Year ended
31 December 2000
Average
balance
Interest
income Yield
Average
balance
Interest
Income Yield
Average
balance
Interest
income Yield
Assets (continued) US$m US$m % US$m US$m % US$m US$m %
Other interest-earning assets
Europe HSBC Bank plc ............... 10,384 198 1.91 2,981 218 7.31 2,522 183 7.26
HSBC Private Banking
Holdings ...................... 3,964 119 3.00 287 85 29.62 1,915 124 6.48
CCF ................................. 2,701 56 2.07 1,586 82 5.17 45 3 6.67
Hong Kong Hang Seng Bank.............. 1,158 33 2.85 1,081 56 5.18 1,335 92 6.89
The Hongkong and
Shanghai Banking
Corporation Limited.... 9,128 238 2.61 7,958 353 4.44 9,890 487 4.92
Rest of Asia-
Pacific
The Hongkong and
Shanghai Banking
Corporation Limited.... 4,349 87 2.00 4,799 181 3.77 5,599 201 3.59
HSBC Bank Malaysia
Berhad ......................... 25 1 4.00 72 4 5.56 30 3 11.52
HSBC Bank Middle East. 744 17 2.28 915 46 5.03 905 60 6.63
North America HSBC USA Inc................ 320 24 7.50 665 46 6.92 1,159 96 8.28
HSBC Bank Canada ....... 1 1 100.00 –3––3–
HSBC Markets Inc........... 64 2 3.13 54 2 3.70 153 8 5.23
South America HSBC Bank Brasil........... 196 24 12.24 370 20 5.41 302 31 10.26
HSBC Bank
Argentina S.A.............. 53 6 11.32 50 5 10.00 4 1 25.00
Other operations ..........................................
(
32,082 )
(
666)2.08 (20,001 ) (963 ) 4.81 (23,148 ) (1,129 ) 4.88
1,005 140 13.93 817 138 16.89 711 163 22.93
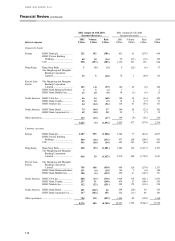
Total interest-earning assets
Europe HSBC Bank plc ............... 170,706 8,365 4.90 140,100 8,891 6.35 136,826 9,686 7.08
HSBC Private Banking
Holdings ...................... 26,799 847 3.16 24,887 1,296 5.21 22,173 1,387 6.26
CCF ................................. 56,949 2,736 4.80 55,445 3,212 5.79 25,512 1,648 6.46
Hong Kong Hang Seng Bank.............. 56,381 1,918 3.40 58,329 3,142 5.39 55,925 4,096 7.32
The Hongkong and
Shanghai Banking
Corporation Limited.... 107,804 3,834 3.56 104,159 5,524 5.30 96,873 6,912 7.13
Rest of Asia-
Pacific
The Hongkong and
Shanghai Banking
Corporation Limited.... 46,919 2,118 4.51 41,481 2,388 5.76 38,734 2,552 6.59
HSBC Bank Malaysia
Berhad ......................... 6,099 310 5.08 6,203 324 5.22 6,444 333 5.17
HSBC Bank Middle East. 8,604 452 5.25 8,184 582 7.11 7,883 670 8.50
North America HSBC USA Inc................ 68,787 3,573 5.19 69,109 4,453 6.44 64,704 4,834 7.47
HSBC Bank Canada ....... 20,118 958 4.76 18,885 1,173 6.21 17,962 1,280 7.13
HSBC Markets Inc........... 29,580 918 3.10 27,843 1,148 4.12 20,067 1,093 5.45
South America HSBC Bank Brasil........... 5,307 1,336 25.17 7,404 1,592 21.50 6,923 1,588 22.94
HSBC Bank
Argentina S.A............... 1,293 315 24.36 3,983 544 13.66 4,091 509 12.44
Other operations .......................................... 3,403 915 26.89 13,653 992 7.27 12,068 1,158 9.60
608,749 28,595 4.70 579,665 35,261 6.08 516,185 37,746 7.31
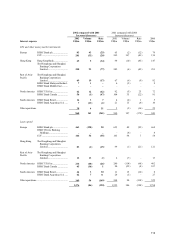
Summary
Total interest-earning assets ........................ 608,749 28,595 4.70 579,665 35,261 6.08 516,185 37,746 7.31
Provisions for bad and doubtful debts .........
(
7,809
)
(7,816 ) (7,980 )
Non interest-earning assets*........................ 132,898 125,290 107,480
Total assets & interest income*................... 733,838 28,595 3.90 697,139 35,261 5.06 615,685 37,746 6.13
*Figures for 2001 have been restated to reflect the adoption of UK Reporting Standard 19 ‘Deferred Tax’, details of which are set out
in Note 1 on the Summary Financial Statements on pages 195 to 197.