HSBC 2002 Annual Report Download - page 263
Download and view the complete annual report
Please find page 263 of the 2002 HSBC annual report below. You can navigate through the pages in the report by either clicking on the pages listed below, or by using the keyword search tool below to find specific information within the annual report.-
 1
1 -
2
-
3
-
4
-
5
-
6
-
7
-
8
-
9
-
10
-
11
-
12
-
13
-
14
-
15
-
16
-
17
-
18
-
19
-
20
-
21
-
22
-
23
-
24
-
25
-
26
-
27
-
28
-
29
-
30
-
31
-
32
-
33
-
34
-
35
-
36
-
37
-
38
-
39
-
40
-
41
-
42
-
43
-
44
-
45
-
46
-
47
-
48
-
49
-
50
-
51
-
52
-
53
-
54
-
55
-
56
-
57
-
58
-
59
-
60
-
61
-
62
-
63
-
64
-
65
-
66
-
67
-
68
-
69
-
70
-
71
-
72
-
73
-
74
-
75
-
76
-
77
-
78
-
79
-
80
-
81
-
82
-
83
-
84
-
85
-
86
-
87
-
88
-
89
-
90
-
91
-
92
-
93
-
94
-
95
-
96
-
97
-
98
-
99
-
100
-
101
-
102
-
103
-
104
-
105
-
106
-
107
-
108
-
109
-
110
-
111
-
112
-
113
-
114
-
115
-
116
-
117
-
118
-
119
-
120
-
121
-
122
-
123
-
124
-
125
-
126
-
127
-
128
-
129
-
130
-
131
-
132
-
133
-
134
-
135
-
136
-
137
-
138
-
139
-
140
-
141
-
142
-
143
-
144
-
145
-
146
-
147
-
148
-
149
-
150
-
151
-
152
-
153
-
154
-
155
-
156
-
157
-
158
-
159
-
160
-
161
-
162
-
163
-
164
-
165
-
166
-
167
-
168
-
169
-
170
-
171
-
172
-
173
-
174
-
175
-
176
-
177
-
178
-
179
-
180
-
181
-
182
-
183
-
184
-
185
-
186
-
187
-
188
-
189
-
190
-
191
-
192
-
193
-
194
-
195
-
196
-
197
-
198
-
199
-
200
-
201
-
202
-
203
-
204
-
205
-
206
-
207
-
208
-
209
-
210
-
211
-
212
-
213
-
214
-
215
-
216
-
217
-
218
-
219
-
220
-
221
-
222
-
223
-
224
-
225
-
226
-
227
-
228
-
229
-
230
-
231
-
232
-
233
-
234
-
235
-
236
-
237
-
238
-
239
-
240
-
241
-
242
-
243
-
244
-
245
-
246
-
247
-
248
-
249
-
250
-
251
-
252
-
 253
253 -
 254
254 -
 255
255 -
 256
256 -
 257
257 -
 258
258 -
 259
259 -
 260
260 -
 261
261 -
 262
262 -
 263
263 -
 264
264 -
 265
265 -
 266
266 -
 267
267 -
 268
268 -
 269
269 -
 270
270 -
 271
271 -
 272
272 -
 273
273 -
274
-
275
-
276
-
277
-
278
-
279
-
280
-
281
-
282
-
283
-
284
-
285
-
286
-
287
-
288
-
289
-
290
-
291
-
292
-
293
-
294
-
295
-
296
-
297
-
298
-
299
-
300
-
301
-
302
-
303
-
304
-
305
-
306
-
307
-
308
-
309
-
310
-
311
-
312
-
313
-
314
-
315
-
316
-
317
-
318
-
319
-
320
-
321
-
322
-
323
-
324
-
325
-
326
-
327
-
328
-
329
 |
 |

261
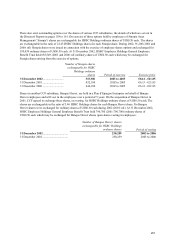
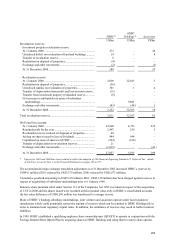
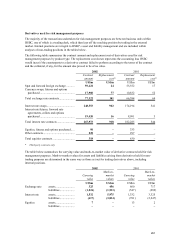
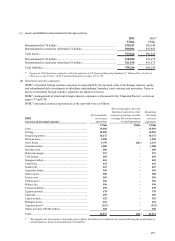
Derivatives used for risk management purposes
The majority of the transactions undertaken for risk management purposes are between business units within
HSBC, one of which is a trading desk, which then lays off the resulting position by trading in the external
market. Internal positions are integral to HSBC’ s asset and liability management and are included within
analyses of non-trading positions in the tables below.
The following table summarises the contract amount and replacement cost of derivatives used for risk
management purposes by product type. The replacement cost shown represents the accounting loss HSBC
would incur if the counterparty to a derivative contract failed to perform according to the terms of the contract
and the collateral, if any, for the amount due proved to be of no value.
2002 2001
Contrac
t
amoun
t
R
eplacemen
t
cos
t
*Contrac
t
amoun
t
R
eplacemen
t
cos
t
*
US$m US$m US$m US$m
Spot and forward foreign exchange ........... 59,422 24 55,552 17
Currency swaps, futures and options
purchased ............................................... 17,900 77 10,832 52
Total exchange rate contracts..................... 77,322 101 66,384 69
Interest rate swaps...................................... 248,553 902 174,194 541
Interest rate futures, forward rate
agreements, collars and options
purchased ............................................... 19,420 16 8,091 3
Total interest rate contracts........................ 267,973 918 182,285 544
Equities, futures and options purchased..... 90
–
333
–
Other contracts........................................... 228
–
297
–
Total equities contracts .............................. 318
–
630
–
*Third party contracts only
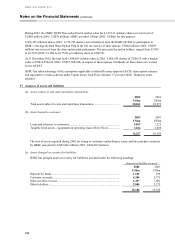
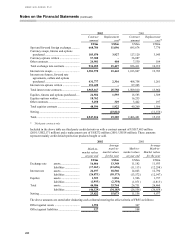
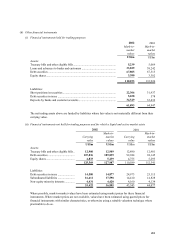
The table below summarises the carrying value and mark-to-market value of derivative contracts held for risk
management purposes. Mark-to-market values for assets and liabilities arising from derivatives held for non-
trading purposes are determined in the same way as those set out for trading derivatives above, including
internal positions.
2002 2001
Carryin
g
value
Mark-to-
marke
t
values Carryin
g
value
Mark-to-
marke
t
values
US$m US$m US$m US$m
Exchange rate assets.......................... 325 456 860 717
liabilities .................... (1,224) (1,533) (547) (289)
Interest rate assets.......................... 1,532 5,975 1,332 3,325
liabilities .................... (617) (3,834) (781) (2,247)
Equities assets.......................... 7
–
13 2
liabilities ....................
–
–
–
–