HSBC 2002 Annual Report Download - page 51
Download and view the complete annual report
Please find page 51 of the 2002 HSBC annual report below. You can navigate through the pages in the report by either clicking on the pages listed below, or by using the keyword search tool below to find specific information within the annual report.-
 1
1 -
2
-
3
-
4
-
5
-
6
-
7
-
8
-
9
-
10
-
11
-
12
-
13
-
14
-
15
-
16
-
17
-
18
-
19
-
20
-
21
-
22
-
23
-
24
-
25
-
26
-
27
-
28
-
29
-
30
-
31
-
32
-
33
-
34
-
35
-
36
-
37
-
38
-
39
-
40
-
 41
41 -
 42
42 -
 43
43 -
 44
44 -
 45
45 -
 46
46 -
 47
47 -
 48
48 -
 49
49 -
 50
50 -
 51
51 -
 52
52 -
 53
53 -
 54
54 -
 55
55 -
 56
56 -
 57
57 -
 58
58 -
 59
59 -
 60
60 -
 61
61 -
62
-
63
-
64
-
65
-
66
-
67
-
68
-
69
-
70
-
71
-
72
-
73
-
74
-
75
-
76
-
77
-
78
-
79
-
80
-
81
-
82
-
83
-
84
-
85
-
86
-
87
-
88
-
89
-
90
-
91
-
92
-
93
-
94
-
95
-
96
-
97
-
98
-
99
-
100
-
101
-
102
-
103
-
104
-
105
-
106
-
107
-
108
-
109
-
110
-
111
-
112
-
113
-
114
-
115
-
116
-
117
-
118
-
119
-
120
-
121
-
122
-
123
-
124
-
125
-
126
-
127
-
128
-
129
-
130
-
131
-
132
-
133
-
134
-
135
-
136
-
137
-
138
-
139
-
140
-
141
-
142
-
143
-
144
-
145
-
146
-
147
-
148
-
149
-
150
-
151
-
152
-
153
-
154
-
155
-
156
-
157
-
158
-
159
-
160
-
161
-
162
-
163
-
164
-
165
-
166
-
167
-
168
-
169
-
170
-
171
-
172
-
173
-
174
-
175
-
176
-
177
-
178
-
179
-
180
-
181
-
182
-
183
-
184
-
185
-
186
-
187
-
188
-
189
-
190
-
191
-
192
-
193
-
194
-
195
-
196
-
197
-
198
-
199
-
200
-
201
-
202
-
203
-
204
-
205
-
206
-
207
-
208
-
209
-
210
-
211
-
212
-
213
-
214
-
215
-
216
-
217
-
218
-
219
-
220
-
221
-
222
-
223
-
224
-
225
-
226
-
227
-
228
-
229
-
230
-
231
-
232
-
233
-
234
-
235
-
236
-
237
-
238
-
239
-
240
-
241
-
242
-
243
-
244
-
245
-
246
-
247
-
248
-
249
-
250
-
251
-
252
-
253
-
254
-
255
-
256
-
257
-
258
-
259
-
260
-
261
-
262
-
263
-
264
-
265
-
266
-
267
-
268
-
269
-
270
-
271
-
272
-
273
-
274
-
275
-
276
-
277
-
278
-
279
-
280
-
281
-
282
-
283
-
284
-
285
-
286
-
287
-
288
-
289
-
290
-
291
-
292
-
293
-
294
-
295
-
296
-
297
-
298
-
299
-
300
-
301
-
302
-
303
-
304
-
305
-
306
-
307
-
308
-
309
-
310
-
311
-
312
-
313
-
314
-
315
-
316
-
317
-
318
-
319
-
320
-
321
-
322
-
323
-
324
-
325
-
326
-
327
-
328
-
329
 |
 |

49
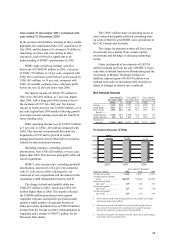
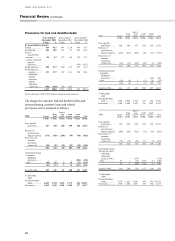
There were no significant changes to HSBC’s
procedures for determining the various components
of the provision for bad and doubtful debts.
The main components of the increase in the bad debt
charge were:
• New specific provisions increased by 15 per
cent, or US$335 million, which was principally
driven by:
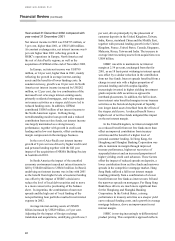
i. new provisions in Europe which were US$195
million higher than in 2000. This reflected a full
year charge for bad and doubtful debts of
US$178 million for CCF for the first time. This
charge mainly arose on corporate borrowers in
the airline and leisure industries. In UK
Banking, lower levels of new specific provision
were raised for consumer loans in First Direct
and on credit card advances but new provisions
for commercial loans were slightly higher and
mainly reflected problems seen in the
manufacturing sector. Although underlying
credit quality remained stable both in the UK
and in France, there was some weakening of
business confidence and a rise in non-
performing loans of US$290 million.
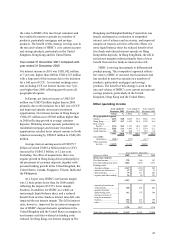
ii. new specific provisions rose by US$114 million
in South America. This reflected the growth in
the consumer lending portfolio in Brazil, for
which provisions are determined on a formula
based on the number of days delinquency. New
specific provisions rose by US$64 million in
Argentina as the impact of the economic turmoil
caused some increase in the level of non-
performing loans.
• The other major factor contributing to the rise in
the bad debt charge was the US$600 million
additional general provision raised for Argentina.
This reflected the severe economic deterioration
and unprecedented political and economic
uncertainty, with government default on foreign
currency debt and on a more generalised
breakdown of the economic and political
structures of the country, manifested most
immediately in a sharp rise in unemployment.
Management judged that the severity of losses
incurred in Argentina was somewhat higher than
had been experienced in the Asian crisis of 1998
and that, taking into account all these factors the
probable inherent loss in its Argentine non-
government loan portfolio approximated 60 per
cent of outstanding customer loans and the
additional general provision increased the
provision coverage to this level. There was also a
modest release of general provisions in the
private bank in Switzerland in view of the
improved loss experience in the book.
During 2000, there had been a release of US$174
million of the special general provision reflecting
Asian risk raised in 1997.
• In aggregate, releases and recoveries were
US$81 million higher than in 2000. Both years
benefited from the releases and recoveries on
problem loans which had been impaired during
the Asian economic crisis in 1998 and 1999
although there was also a significant recovery
and release on Olympia and York in 2001.
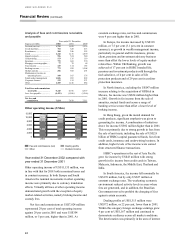
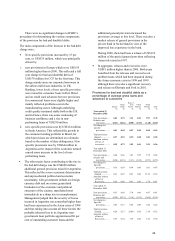
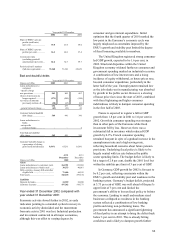
Provisions for bad and doubtful debts as a
percentage of average gross loans and
advances to customers
Euro
p
e
Hon
g
Kon
g
Rest o
f
Asi
a
Pacific
Nort
h
Americ
a
Sout
h
Americ
a
Tota
l
%% % % %%
Year ended 31
December 2002
New provisions ..... 0.62 0.75 1.13 0.51 9.97 0.78
Releases and
recoveries ......... (0.21 ) (0.26 ) (0.90 ) (0.15 ) (1.48 ) (0.29 )
Net charge for
specific
p
rovisions......... 0.41 0.49 0.23 0.36 8.49 0.49
Total provisions
charge
d
................. 0.37 0.35 0.25 0.38 3.01 0.38
Amounts written
off net of
recoveries........... 0.25 0.72 1.55 0.41 3.91 0.56
Year ended 31
December 2001
New provisions ..... 0.60 0.66 1.85 0.55 5.72 0.82
releases and
recoveries ......... (0.24 ) (0.36 ) (1.31 ) (0.12 ) (0.71 ) (0.35 )
Net charge for
Specific
p
rovisions......... 0.36 0.30 0.54 0.43 5.01 0.47
Total provisions
charge
d
................ 0.33 0.29 0.55 0.42 15.36 0.65
Amounts written
off net of
Recoveries.......... 0.28 0.88 0.93 0.39 5.78 0.61
Year ended 31
December 2000
New provisions ..... 0.53 0.68 1.70 0.66 4.07 0.81
Releases and
recoveries ......... (0.28 ) (0.31 ) (1.16 ) (0.17 ) (0.65 ) (0.39 )
Net charge for
Specific
p
rovisions......... 0.25 0.37 0.54 0.49 3.42 0.42
Total provisions
charge
d
................ 0.28 0.37 (0.05) 0.26 3.39 0.32
Amounts written
off net of
Recoveries.......... 0.35 0.64 1.39 0.45 1.43 0.58