HSBC 2002 Annual Report Download - page 228
Download and view the complete annual report
Please find page 228 of the 2002 HSBC annual report below. You can navigate through the pages in the report by either clicking on the pages listed below, or by using the keyword search tool below to find specific information within the annual report.-
 1
1 -
2
-
3
-
4
-
5
-
6
-
7
-
8
-
9
-
10
-
11
-
12
-
13
-
14
-
15
-
16
-
17
-
18
-
19
-
20
-
21
-
22
-
23
-
24
-
25
-
26
-
27
-
28
-
29
-
30
-
31
-
32
-
33
-
34
-
35
-
36
-
37
-
38
-
39
-
40
-
41
-
42
-
43
-
44
-
45
-
46
-
47
-
48
-
49
-
50
-
51
-
52
-
53
-
54
-
55
-
56
-
57
-
58
-
59
-
60
-
61
-
62
-
63
-
64
-
65
-
66
-
67
-
68
-
69
-
70
-
71
-
72
-
73
-
74
-
75
-
76
-
77
-
78
-
79
-
80
-
81
-
82
-
83
-
84
-
85
-
86
-
87
-
88
-
89
-
90
-
91
-
92
-
93
-
94
-
95
-
96
-
97
-
98
-
99
-
100
-
101
-
102
-
103
-
104
-
105
-
106
-
107
-
108
-
109
-
110
-
111
-
112
-
113
-
114
-
115
-
116
-
117
-
118
-
119
-
120
-
121
-
122
-
123
-
124
-
125
-
126
-
127
-
128
-
129
-
130
-
131
-
132
-
133
-
134
-
135
-
136
-
137
-
138
-
139
-
140
-
141
-
142
-
143
-
144
-
145
-
146
-
147
-
148
-
149
-
150
-
151
-
152
-
153
-
154
-
155
-
156
-
157
-
158
-
159
-
160
-
161
-
162
-
163
-
164
-
165
-
166
-
167
-
168
-
169
-
170
-
171
-
172
-
173
-
174
-
175
-
176
-
177
-
178
-
179
-
180
-
181
-
182
-
183
-
184
-
185
-
186
-
187
-
188
-
189
-
190
-
191
-
192
-
193
-
194
-
195
-
196
-
197
-
198
-
199
-
200
-
201
-
202
-
203
-
204
-
205
-
206
-
207
-
208
-
209
-
210
-
211
-
212
-
213
-
214
-
215
-
216
-
217
-
 218
218 -
 219
219 -
 220
220 -
 221
221 -
 222
222 -
 223
223 -
 224
224 -
 225
225 -
 226
226 -
 227
227 -
 228
228 -
 229
229 -
 230
230 -
 231
231 -
 232
232 -
 233
233 -
 234
234 -
 235
235 -
 236
236 -
 237
237 -
 238
238 -
239
-
240
-
241
-
242
-
243
-
244
-
245
-
246
-
247
-
248
-
249
-
250
-
251
-
252
-
253
-
254
-
255
-
256
-
257
-
258
-
259
-
260
-
261
-
262
-
263
-
264
-
265
-
266
-
267
-
268
-
269
-
270
-
271
-
272
-
273
-
274
-
275
-
276
-
277
-
278
-
279
-
280
-
281
-
282
-
283
-
284
-
285
-
286
-
287
-
288
-
289
-
290
-
291
-
292
-
293
-
294
-
295
-
296
-
297
-
298
-
299
-
300
-
301
-
302
-
303
-
304
-
305
-
306
-
307
-
308
-
309
-
310
-
311
-
312
-
313
-
314
-
315
-
316
-
317
-
318
-
319
-
320
-
321
-
322
-
323
-
324
-
325
-
326
-
327
-
328
-
329
 |
 |

HSBC HOLDINGS PLC
Notes on the Financial Statements (continued)
226
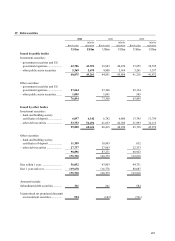
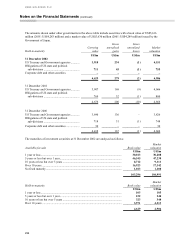
20 Equity shares
2002 2001 2000
Book value
M
arke
t
valuation Book value
M
arke
t
valuation Book value
M
arke
t
valuation
US$m US$m US$m US$m US$m US$m
Investment securities:
– listed on a recognised UK
exchange ............................. 563 505 695 688 722 1,005
– listed in Hong Kong............ 241 400 245 564 270 742
– listed elsewhere................... 1,163 1,207 1,389 1,436 1,247 1,382
– unlisted................................ 2,866 3,127 2,426 2,606 2,399 2,644
4,833 5,239 4,755 5,294 4,638 5,773
Other securities:
– listed on a recognised UK
exchange ............................. 670 713 1,071
–listed in Hong Kong............ 974 228
–listed elsewhere................... 2,576 2,405 1,953
– unlisted................................ 125 110 214
8,213 8,057 8,104
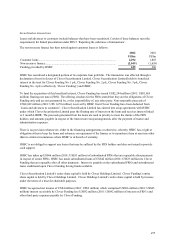
Where securities are carried at market value, and the market value is higher than cost, the difference between cost
and market value is not disclosed as it cannot be determined without unreasonable expense.
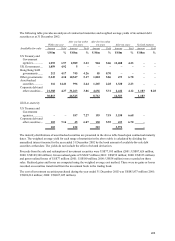
Included within Investment securities – listed on a recognised UK exchange are US$549 million (2001: US$608
million; 2000:US$582 million) of shares in HSBC Holdings with a market value of US$519 million (2001: US$541
million; 2000: US$596 million), comprising:
(a) US$514 million (2001: US$555 million; 2000: US$564 million) of shares as explained in note 26 (a).
(b) US$14 million, after amortisation, (2001: US$43 million; 2000: US$18 million) of shares held in trusts
established by subsidiary companies for the purposes of conditional awards under the Restricted Share Plan,
details of which are provided in the Directors’ Remuneration Report on pages 173 and 177. At 31 December
2002, such trusts held 5,029,157 ordinary shares (2001: 3,455,821; 2000: 2,143,646) with a market value at that
date of US$56 million (2001: US$40 million; 2000: US$ 32 million)
(c) US$21 million, after amortisation, (2001: US$10 million; 2000: US$ nil) of shares held in trusts established by
subsidiary companies which may be used in respect of the exercise of share options or for the purposes of share
awards as detailed in note 35. At 31 December 2002, such trusts held 1,482,249 (2001: 796,700; 2000: nil)
shares with a market value at that date of US$16 million (2001: US$10 million; 2000: US$ nil).
Included within ‘Other securities – listed on a recognised UK exchange’ are 3,090,776 (2001: 1,369,901; 2000:
5,871,062) shares in HSBC Holdings valued at US$34 million (2001: US$16 million; 2000: US$86 million) held by
subsidiary undertakings as equity market-makers.