HSBC 2002 Annual Report Download - page 271
Download and view the complete annual report
Please find page 271 of the 2002 HSBC annual report below. You can navigate through the pages in the report by either clicking on the pages listed below, or by using the keyword search tool below to find specific information within the annual report.-
 1
1 -
2
-
3
-
4
-
5
-
6
-
7
-
8
-
9
-
10
-
11
-
12
-
13
-
14
-
15
-
16
-
17
-
18
-
19
-
20
-
21
-
22
-
23
-
24
-
25
-
26
-
27
-
28
-
29
-
30
-
31
-
32
-
33
-
34
-
35
-
36
-
37
-
38
-
39
-
40
-
41
-
42
-
43
-
44
-
45
-
46
-
47
-
48
-
49
-
50
-
51
-
52
-
53
-
54
-
55
-
56
-
57
-
58
-
59
-
60
-
61
-
62
-
63
-
64
-
65
-
66
-
67
-
68
-
69
-
70
-
71
-
72
-
73
-
74
-
75
-
76
-
77
-
78
-
79
-
80
-
81
-
82
-
83
-
84
-
85
-
86
-
87
-
88
-
89
-
90
-
91
-
92
-
93
-
94
-
95
-
96
-
97
-
98
-
99
-
100
-
101
-
102
-
103
-
104
-
105
-
106
-
107
-
108
-
109
-
110
-
111
-
112
-
113
-
114
-
115
-
116
-
117
-
118
-
119
-
120
-
121
-
122
-
123
-
124
-
125
-
126
-
127
-
128
-
129
-
130
-
131
-
132
-
133
-
134
-
135
-
136
-
137
-
138
-
139
-
140
-
141
-
142
-
143
-
144
-
145
-
146
-
147
-
148
-
149
-
150
-
151
-
152
-
153
-
154
-
155
-
156
-
157
-
158
-
159
-
160
-
161
-
162
-
163
-
164
-
165
-
166
-
167
-
168
-
169
-
170
-
171
-
172
-
173
-
174
-
175
-
176
-
177
-
178
-
179
-
180
-
181
-
182
-
183
-
184
-
185
-
186
-
187
-
188
-
189
-
190
-
191
-
192
-
193
-
194
-
195
-
196
-
197
-
198
-
199
-
200
-
201
-
202
-
203
-
204
-
205
-
206
-
207
-
208
-
209
-
210
-
211
-
212
-
213
-
214
-
215
-
216
-
217
-
218
-
219
-
220
-
221
-
222
-
223
-
224
-
225
-
226
-
227
-
228
-
229
-
230
-
231
-
232
-
233
-
234
-
235
-
236
-
237
-
238
-
239
-
240
-
241
-
242
-
243
-
244
-
245
-
246
-
247
-
248
-
249
-
250
-
251
-
252
-
253
-
254
-
255
-
256
-
257
-
258
-
259
-
260
-
 261
261 -
 262
262 -
 263
263 -
 264
264 -
 265
265 -
 266
266 -
 267
267 -
 268
268 -
 269
269 -
 270
270 -
 271
271 -
 272
272 -
 273
273 -
 274
274 -
 275
275 -
 276
276 -
 277
277 -
 278
278 -
 279
279 -
 280
280 -
 281
281 -
282
-
283
-
284
-
285
-
286
-
287
-
288
-
289
-
290
-
291
-
292
-
293
-
294
-
295
-
296
-
297
-
298
-
299
-
300
-
301
-
302
-
303
-
304
-
305
-
306
-
307
-
308
-
309
-
310
-
311
-
312
-
313
-
314
-
315
-
316
-
317
-
318
-
319
-
320
-
321
-
322
-
323
-
324
-
325
-
326
-
327
-
328
-
329
 |
 |

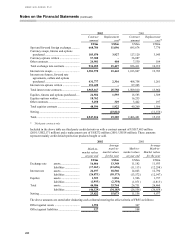
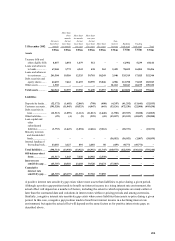
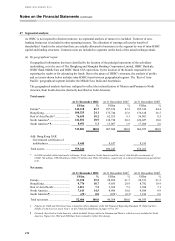
269
31 December 2002
Not more
than three
months
More than
three
months
but not
more than
six months
More than
six months
but no
t
more than
one yea
r
More than
one yea
r
but no
t
more than
five years More than
five years
Non-
interes
t
bearin
g
Bankin
g
book total Tradin
g
book total Total
US$m US$m US$m US$m US$m US$m US$m US$m US$m
Assets
Treasury bills and
other eligible bills 8,857 2,054 1,479 512 – – 12,902 5,239 18,141
Loans and advances
to banks ............... 67,568 3,772 4,243 438 262 2,409 78,692 16,804 95,496
Loans and advances
to customers ........ 241,504 19,510 12,335 39,781 18,249 3,940 335,319 17,025 352,344
Debt securities and
equity shares........ 42,693 7,661 11,493 30,959 15,046 4,906 112,758 71,185 183,943
Other assets ............. 1,902 – – – – 81,261 83,163 26,159 109,322
Total assets............. 362,524 32,997 29,550 71,690 33,557 92,516 622,834 136,412 759,246
Liabilities
Deposits by banks ... (32,172 ) (1,602 ) (2,065 ) (798 ) (408) (4,247) (41,292 ) (11,641 ) (52,933 )
Customer accounts .. (391,328 ) (11,945 ) (10,533 ) (4,947 ) (641) (53,136) (472,530 ) (22,908) (495,438 )
Debt securities in
issue ..................... (12,913 ) (1,859 ) (1,112 ) (11,013 ) (1,440) (1,590) (29,927 ) (5,038 ) (34,965 )
Other liabilities........ (29) (4) (9) (259) (45) (53,187) (53,533 ) (45,047) (98,580 )
Loan capital and
other
subordinated
liabilities.............. (3,753) (1,647 ) (1,094 ) (2,616 ) (9,261 ) – (18,371 ) – (18,371 )
Minority interests
and shareholders’
funds..................... – – – – – (56,952) (56,952) (2,007) (58,959)
Internal funding of
the trading book... 43,481 3,127 891 2,681 50 (459) 49,771 (49,771) –
Total liabilities ....... (396,714) (13,930) (13,922) (16,952) (11,745) (169,571) (622,834) (136,412) (759,246)
Off-balance-sheet
items ................... (31,517 ) 1,443 7,630 24,982 (2,538) – – – –
Interest rate
sensitivity gap .... (65,707) 20,510 23,258 79,720 19,274 (77,055) – – –
Cumulative
interest rate
sensitivity gap .... (65,707) (45,197) (21,939) 57,781 77,055 – – – –
A positive interest rate sensitivity gap exists where more assets than liabilities re-price during a given period.
Although a positive gap position tends to benefit net interest income in a rising interest rate environment, the
actual effect will depend on a number of factors, including the extent to which repayments are made earlier or
later than the contracted date and variations in interest rates within re-pricing periods and among currencies.
Similarly, a negative interest rate sensitivity gap exists where more liabilities than assets re-price during a given
period. In this case, a negative gap position tends to benefit net interest income in a declining interest rate
environment, but again the actual effect will depend on the same factors as for positive interest rate gaps, as
described above.