Frontier Airlines 2007 Annual Report Download - page 40
Download and view the complete annual report
Please find page 40 of the 2007 Frontier Airlines annual report below. You can navigate through the pages in the report by either clicking on the pages listed below, or by using the keyword search tool below to find specific information within the annual report.-
 1
1 -
2
-
3
-
4
-
5
-
6
-
7
-
8
-
9
-
10
-
11
-
12
-
13
-
14
-
15
-
16
-
17
-
18
-
19
-
20
-
21
-
22
-
23
-
24
-
25
-
26
-
27
-
28
-
29
-
 30
30 -
 31
31 -
 32
32 -
 33
33 -
 34
34 -
 35
35 -
 36
36 -
 37
37 -
 38
38 -
 39
39 -
 40
40 -
 41
41 -
 42
42 -
 43
43 -
 44
44 -
 45
45 -
 46
46 -
 47
47 -
 48
48 -
 49
49 -
 50
50 -
51
-
52
-
53
-
54
-
55
-
56
-
57
-
58
-
59
-
60
-
61
-
62
-
63
-
64
-
65
-
66
-
67
-
68
-
69
-
70
-
71
-
72
-
73
-
74
-
75
-
76
-
77
-
78
-
79
-
80
-
81
-
82
-
83
-
84
-
85
-
86
-
87
-
88
-
89
-
90
-
91
-
92
-
93
-
94
-
95
-
96
-
97
-
98
-
99
-
100
-
101
-
102
-
103
-
104
-
105
-
106
-
107
 |
 |

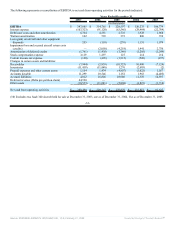
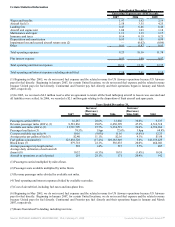
Available seat miles (000’s) (5) 11,511,795 9,154,719 6,559,966 4,618,042 3,665,876
Passenger load factor (6) 74.5% 72.6% 68.8% 66.3% 63.3%
Revenue per available seat mile (7) $ 0.112 $ 0.125 $ 0.138 $ 0.140 $ 0.134
Cost per available seat mile (8) $ 0.102 $ 0.112 $ 0.124 $ 0.126 $ 0.118
EBITDA (9) $ 347,885 $ 314,765 $ 228,597 $ 126,275 $ 106,779
Average passenger trip length (miles) 522 515 494 448 453
Number of aircraft in operations (end of
period):
Regional Jets:
Owned 131 109 90 62 38
Leased 88 62 52 49 45
Saab Turboprops (10):
Owned — — — 4 —
Leased — — — 13 21
Total aircraft 219 171 142 128 104
-31-
Source: REPUBLIC AIRWAYS HOLDINGS INC, 10-K, February 21, 2008 Powered by Morningstar® Document Research℠