Frontier Airlines 2007 Annual Report Download - page 39
Download and view the complete annual report
Please find page 39 of the 2007 Frontier Airlines annual report below. You can navigate through the pages in the report by either clicking on the pages listed below, or by using the keyword search tool below to find specific information within the annual report.-
 1
1 -
2
-
3
-
4
-
5
-
6
-
7
-
8
-
9
-
10
-
11
-
12
-
13
-
14
-
15
-
16
-
17
-
18
-
19
-
20
-
21
-
22
-
23
-
24
-
25
-
26
-
27
-
28
-
 29
29 -
 30
30 -
 31
31 -
 32
32 -
 33
33 -
 34
34 -
 35
35 -
 36
36 -
 37
37 -
 38
38 -
 39
39 -
 40
40 -
 41
41 -
 42
42 -
 43
43 -
 44
44 -
 45
45 -
 46
46 -
 47
47 -
 48
48 -
 49
49 -
50
-
51
-
52
-
53
-
54
-
55
-
56
-
57
-
58
-
59
-
60
-
61
-
62
-
63
-
64
-
65
-
66
-
67
-
68
-
69
-
70
-
71
-
72
-
73
-
74
-
75
-
76
-
77
-
78
-
79
-
80
-
81
-
82
-
83
-
84
-
85
-
86
-
87
-
88
-
89
-
90
-
91
-
92
-
93
-
94
-
95
-
96
-
97
-
98
-
99
-
100
-
101
-
102
-
103
-
104
-
105
-
106
-
107
 |
 |

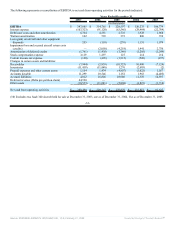
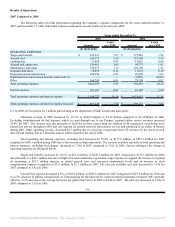
ITEM 6. SELECTED FINANCIAL DATA
The following selected financial data and operating statistics should be read in conjunction with Management's Discussion and
Analysis of Financial Condition and Results of Operations, and the consolidated financial statements and related notes included in
Item 8 of the Form 10-K.
Years Ended December 31,
2007 2006 2005 2004 2003
(in thousands, except share, per share and airline operating data)
Statement of Operations Data:
Operating revenues:
Regional airline services $ 1,274,607 $ 1,118,226 $ 883,906 $ 637,389 $ 480,025
Charter and ground handling 5,867 8,932 11,611 8,682 5,899
Other 12,203 15,920 9,504 253 6,356
Total operating revenues 1,292,677 1,143,078 905,021 646,324 492,280
Operating expenses:
Wages and benefits 226,521 175,483 143,826 112,305 86,949
Aircraft fuel (1) 296,573 325,500 278,923 174,208 106,840
Passenger fees and commissions — — — 2,939 6,254
Landing fees 53,684 41,993 30,376 24,201 19,098
Aircraft and engine rent 124,961 94,773 77,725 74,514 67,350
Maintenance and repair 130,237 105,198 76,481 70,290 53,475
Insurance and taxes 19,039 17,652 16,117 13,186 12,859
Depreciation and amortization 106,594 92,228 64,877 34,412 23,873
Impairment loss and accrued aircraft return
costs
(credits) (2) — (2,050) (4,218) 1,441 2,756
Other 104,790 79,708 62,195 47,483 30,115
Total operating expenses 1,062,399 930,485 746,302 554,979 409,569
Operating income 230,278 212,593 158,719 91,345 82,711
Other income (expense):
Interest expense (107,323) (91,128) (63,546) (28,464) (22,789)
Interest and other income 11,013 9,944 5,002 518 195
Total other income (expense) (96,310) (81,184) (58,544) (27,946) (22,594)
Income before income taxes 133,968 131,409 100,175 63,399 60,117
Income tax expense 51,210 51,899 39,521 24,547 23,979
Net income 82,758 79,510 60,654 38,852 36,138
Preferred stock dividends (3) — — — — (170)
Net income available for common
stockholders $ 82,758 $ 79,510 $ 60,654 $ 38,852 $ 35,968
Net income available for common
stockholders
per share:
Basic $ 2.05 $ 1.89 $ 1.69 $ 1.66 $ 1.80
Diluted $ 2.02 $ 1.82 $ 1.66 $ 1.62 $ 1.73
Weighted average common shares
outstanding:
Basic 40,350,256 42,149,668 35,854,249 23,349,613 20,000,000
Diluted 41,045,644 43,615,946 36,548,340 23,906,762 20,841,415
Other Financial Data:
Net cash from:
Operating activities $ 280,490 $ 229,147 $ 170,879 $ 116,827 $ 91,627
Investing activities $ (76,468) $ (114,510) $ (175,152) $ (102,424) $ (30,683)
Financing activities $ (235,546) $ (81,114) $ 120,058 $ 9,282 $ (45,093)
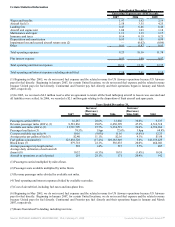
Airline Operating Data:
Passengers carried (000’s) 16,287 12,666 9,137 6,842 5,121
Revenue passenger miles (000’s) (4) 8,581,836 6,650,399 4,516,518 3,062,940 2,319,261
Source: REPUBLIC AIRWAYS HOLDINGS INC, 10-K, February 21, 2008 Powered by Morningstar® Document Research℠