Energizer 2009 Annual Report Download - page 47
Download and view the complete annual report
Please find page 47 of the 2009 Energizer annual report below. You can navigate through the pages in the report by either clicking on the pages listed below, or by using the keyword search tool below to find specific information within the annual report.-
 1
1 -
2
-
3
-
4
-
5
-
6
-
7
-
8
-
9
-
10
-
11
-
12
-
13
-
14
-
15
-
16
-
17
-
18
-
19
-
20
-
21
-
22
-
23
-
24
-
25
-
26
-
27
-
28
-
29
-
30
-
31
-
32
-
33
-
34
-
35
-
36
-
 37
37 -
 38
38 -
 39
39 -
 40
40 -
 41
41 -
 42
42 -
 43
43 -
 44
44 -
 45
45 -
 46
46 -
 47
47 -
 48
48 -
 49
49 -
 50
50 -
 51
51 -
 52
52
 |
 |

ENERGIZER HOLDINGS INC. 2009 ANNUAL REPORT PAGE 45
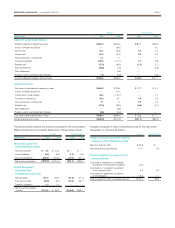
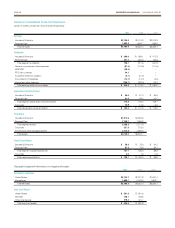
Allowance for Doubtful Accounts
2009 2008 2007
Balance at beginning of year $ 11.2 $ 9.8 $ 10.9
Impact of Playtex acquisition – 4.0 –
Provision charged to expense, net of reversals 5.9 (0.2) (0.2)
Write-offs, less recoveries, translation, other (5.8) (2.4) (0.9)
Balance at end of year $ 11.3 $ 11.2 $ 9.8
Income Tax Valuation Allowance
2009 2008 2007
Balance at beginning of year $ 9.1 $ 4.9 $ 10.7
Impact of Playtex acquisition – 5.0 –
Provision charged to expense 1.2 0.1 0.5
Reversal of provision charged to expense – (0.4) (4.3)
Write-offs, translation, other – (0.5) (2.0)
Balance at end of year $ 10.3 $ 9.1 $ 4.9
Supplemental Disclosure of Cash Flow Information
2009 2008 2007
Interest paid $150.4 $143.6 $ 90.4
Income taxes paid 167.3 90.6 108.5
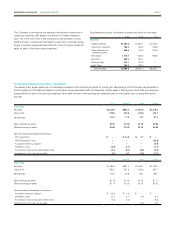
18. Segment Information
Operations for the Company are managed via two segments – House-
hold Products (Battery and Lighting Products) and Personal Care (Wet
Shave, including Edge/Skintimate acquired in June 2009, Skin Care,
Feminine Care and Infant Care). Segment performance is evaluated
based on segment operating profit, exclusive of general corporate
expenses, share-based compensation costs, costs associated with
most restructuring, integration or business realignment activities,
including the VERO, RIF and change in paid time off policy in 2009,
and amortization of intangible assets. Financial items, such as
interest income and expense, are managed on a global basis at
the corporate level.
The reduction in gross profit associated with the write-up and
subsequent sale of the inventory acquired in the shave preparation
acquisition in fiscal 2009, and the Playtex acquisition in fiscal 2008,
and the associated acquisition integration costs, which are included
in Corporate and Other expense, are not reflected in the Personal
Care segment, but rather presented as a separate line item below
segment profit, as it is a non-recurring item directly associated with
the acquisitions.
The favorable adjustments in 2009 related to the change in policy gov-
erning the Company’s paid time off (PTO) are not reflected in Household
Products or Personal Care segments, but rather presented as a sepa-
rate line item below segment profit as it is not operational in nature.
The charge in 2009 for the VERO and RIF that took place primarily in the
Household Products business are presented as a separate line below
segment profit.
The presentation for inventory write-up, acquisition integration costs,
PTO adjustment and VERO/RIF costs reflects management’s view on
how it evaluates segment performance.
The Company’s operating model includes a combination of stand-alone
and combined business functions between the Household Products and
Personal Care businesses, varying by country and region of the world.
Shared functions include product warehousing and distribution, various
transaction processing functions, and in some countries, combined
sales forces and management. The Company applies a fully allocated
cost basis, in which shared business functions are allocated between
the businesses. Such allocations do not represent the costs of such
services if performed on a stand-alone basis. The Company applies
a fully allocated cost basis in which shared business functions are
allocated between the businesses.
Wal-Mart Stores, Inc. and its subsidiaries accounted for 21.4%, 20.8%
and 18.8% of total net sales in 2009, 2008 and 2007, respectively,
primarily in North America. Corporate assets shown in the following table
include all cash and cash equivalents, financial instruments and deferred
tax assets that are managed outside of operating segments.