Energizer 2009 Annual Report Download - page 15
Download and view the complete annual report
Please find page 15 of the 2009 Energizer annual report below. You can navigate through the pages in the report by either clicking on the pages listed below, or by using the keyword search tool below to find specific information within the annual report.-
 1
1 -
2
-
3
-
4
-
 5
5 -
 6
6 -
 7
7 -
 8
8 -
 9
9 -
 10
10 -
 11
11 -
 12
12 -
 13
13 -
 14
14 -
 15
15 -
 16
16 -
 17
17 -
 18
18 -
 19
19 -
 20
20 -
 21
21 -
 22
22 -
 23
23 -
 24
24 -
 25
25 -
26
-
27
-
28
-
29
-
30
-
31
-
32
-
33
-
34
-
35
-
36
-
37
-
38
-
39
-
40
-
41
-
42
-
43
-
44
-
45
-
46
-
47
-
48
-
49
-
50
-
51
-
52
 |
 |

ENERGIZER HOLDINGS INC. 2009 ANNUAL REPORT PAGE 13
The Company’s operating model includes a combination of stand-
alone and combined business functions between Household Products
and Personal Care, varying by country and region of the world. Shared
functions include product warehousing and distribution, various trans-
action processing functions, and, in some countries, a combined sales
force and management. Such allocations do not represent the costs
of such services if performed on a stand-alone basis. The Company
applies a fully allocated cost basis, in which shared business functions
are allocated between the businesses.
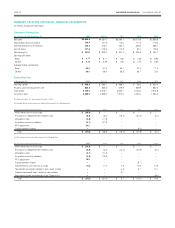
HOUSE HOL D P ROD UCT S
2009 2008 2007
Net sales $2,109.5 $2,474.3 $2,376.3
Segment profit $ 398.6 $ 489.1 $ 472.3
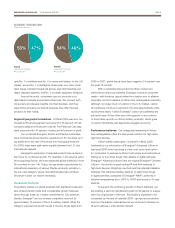
For the year ended September 30, 2009, net sales were $2,109.5,
down $364.8, or 15% including the impact of approximately $144
of unfavorable currency. Absent currency, sales decreased approxi-
mately $220, or 9%, due to lower sales volume across all geographic
areas, but most notably in the U.S. We estimate the premium battery
category declined approximately 9% in fiscal 2009 as consumers
cut spending and retailers reduced inventory levels during the year
in response to the economic downturn. In addition, we estimate that
year over year sales were negatively impacted by approximately $55
of shipments in the prior year related to hurricanes and early holiday
shipments ahead of an announced price increase, which were not
repeated in fiscal 2009.
Segment profit decreased $90.5, including approximately $76 of
unfavorable currency. Excluding the impact of unfavorable currency,
segment profit declined approximately $14 as lower gross margin
from volume declines was significantly offset by reduced spending in
advertising/promotion and overheads, which collectively decreased
approximately $45 as compared to fiscal 2008, and favorable pricing
and product mix.
For the year ended September 30, 2008, sales increased $98.0,
inclusive of approximately $88 of favorable currency versus fiscal 2007.
Absent currency, sales increased $10, as favorable pricing and product
mix were partially offset by lower sales volume. Soft overall category
demand in most of the developed world was nearly offset by fiscal
2008 sales to meet hurricane demand and early holiday season buy-in
within the U.S. and volume growth in Central and Eastern Europe and
Latin America. Overall pricing and price mix was favorable $15.8 as
compared to fiscal 2007 as list price increases taken to offset rising
material costs were partially offset by sales shifting to larger pack sizes,
which sell at lower per unit prices.
Segment profit in fiscal 2008 increased $16.8 but declined approxi-
mately $35 after excluding favorable currency impacts as compared
to fiscal 2007 as the benefit of higher pricing was more than offset by
unfavorable product cost of $63.2 due primarily to higher commodity
material costs and unfavorable production volumes. Excluding
currency impacts, higher SG&A expenses were nearly offset by
lower A&P spending.
Looking forward, we remain cautious regarding consumption in the
battery category as retailer inventory investment remains uncertain, the
speed of the economic recovery, especially as it relates to consumer
spending, is slow and device trends in the battery category remain
difficult to assess given the recent economic downturn.
As noted previously, the significant unfavorable currency environment
in fiscal 2009 coupled with the economic downturn reduced segment
profit in Household Products measurably. In response to these factors,
the Company reduced spending in both advertising and promotion and
overheads, in the short term, to somewhat mitigate the negative impact
of currency and the economy on segment profit. For fiscal 2010, we
expect to return to more historical investment levels for advertising and
promotion and increase funding for other targeted growth initiatives
after a year of aggressive cost containment.
Funding for these efforts will come partially from lower commodities,
raw materials and other input costs, which are estimated to be favor-
able approximately $12 to $14 in 2010 compared to 2009 average
costs based on current market conditions. In addition, we expect
segment profit to be positively impacted by favorable currency as
compared to fiscal 2009 in the range of $40 to $43, net of the impact
of hedging activities, based on current exchange rates.
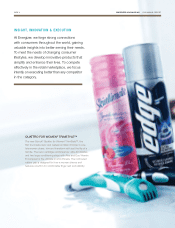
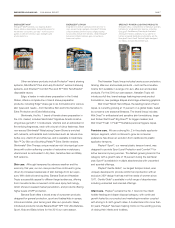
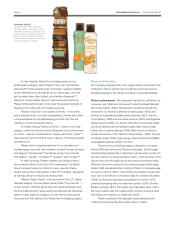
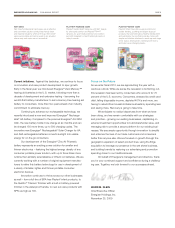
PE RSO NAL CA RE
2009 2008 2007
Net sales $1,890.3 $1,856.7 $988.8
Segment profit $ 341.1 $ 322.5 $155.5
Net sales for the fiscal year were $1,890.3, an increase of $33.6, or
2%, including the impact of approximately $80 of unfavorable currency.
Excluding the impact of unfavorable currency, sales increased approxi-
mately 6% due to the shave preparation acquisition, which added $57,
or 3%, and higher sales of Wet Shave, Infant Care and Skin Care prod-
ucts partially offset by lower sales of Feminine Care. Wet Shave sales
increased 3%, excluding the acquisition and currency, driven by the
launch of Quattro for Women Trimmer in the second quarter, and higher
disposable and Quattro men’s systems sales, partially offset by ongoing
declines in legacy system products. Infant Care sales increased 7%
driven by Diaper Genie, cups and soothing products. Skin Care sales
increased 4% on higher sales of Wet Ones, and higher sales for sun care
primarily in international markets. Feminine Care sales decreased 2% as
higher sales of Playtex Sport were offset by lower sales of Gentle Glide,
due, in part, to increased competitive activity.
Segment profit for the fiscal year was $341.1, an increase of $18.6 or
6% inclusive of unfavorable currency of approximately $20. Excluding
currency, segment profit grew approximately $39 or 12% due to
incremental Playtex synergies of approximately $32, lower A&P of
approximately $17, and the inclusion of the shave preparation
acquisition, which added $4, partially offset by higher product
costs and unfavorable product mix.