Energizer 2009 Annual Report Download - page 34
Download and view the complete annual report
Please find page 34 of the 2009 Energizer annual report below. You can navigate through the pages in the report by either clicking on the pages listed below, or by using the keyword search tool below to find specific information within the annual report.-
 1
1 -
2
-
3
-
4
-
5
-
6
-
7
-
8
-
9
-
10
-
11
-
12
-
13
-
14
-
15
-
16
-
17
-
18
-
19
-
20
-
21
-
22
-
23
-
 24
24 -
 25
25 -
 26
26 -
 27
27 -
 28
28 -
 29
29 -
 30
30 -
 31
31 -
 32
32 -
 33
33 -
 34
34 -
 35
35 -
 36
36 -
 37
37 -
 38
38 -
 39
39 -
 40
40 -
 41
41 -
 42
42 -
 43
43 -
 44
44 -
45
-
46
-
47
-
48
-
49
-
50
-
51
-
52
 |
 |

PAGE 32 ENERGIZER HOLDINGS INC. 2009 ANNUAL REPORT
The increase in the gross amortizable intangible assets during fiscal
2009 is due primarily to the valuation of assets acquired in the shave
preparation acquisition. Amortizable intangible assets, with a weighted
average remaining life of approximately seven years, are amortized on
a straight-line basis over expected lives of 5 years to 15 years.
Amortization expense for intangible assets totaled $13.5 for the current
year. Estimated amortization expense for amortizable intangible assets
for the year ending September 30, 2010 is approximately $13.9,
$13.5 for each of the years ending September 30, 2011 and 2012,
and $11.2 and $8.2 for the years ending September 30, 2013 and
2014, respectively.
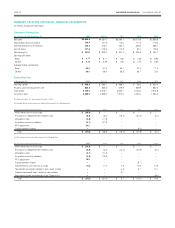
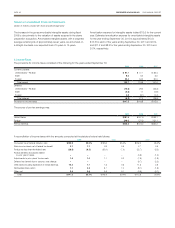
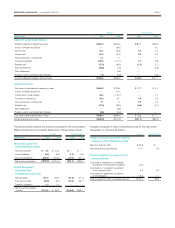
A reconciliation of income taxes with the amounts computed at the statutory federal rate follows:
2009 2008 2007
Computed tax at federal statutory rate $155.9 35.0% $165.6 35.0% $152.0 35.0%
State income taxes, net of federal tax benefit 5.1 1.1 2.6 0.6 2.7 0.6
Foreign tax less than the federal rate (28.9) (6.5) (33.1) (7.0) (22.7) (5.2)
Foreign benefits recognized related
to prior years’ losses
–
–
–
– (4.3) (1.0)
Adjustments to prior years’ tax accruals 1.5 1.0 1.1 0.2 (7.9) (1.8)
Deferred tax benefit due to statutory rate change – – – – (9.7) (2.2)
Other taxes including repatriation of foreign earnings 10.4 1.7 1.5 0.3 11.3 2.6
Nontaxable share option 1.1 0.2 5.7 1.2 (8.1) (1.9)
Other, net 2.4 0.6 0.5 0.1 (0.5) (0.1)
Total $147.5 33.1% $143.9 30.4% $112.8 26.0%
5. Income Taxes
The provisions for income taxes consisted of the following for the years ended September 30:
2009 2008 2007
Currently payable:
United States – Federal $ 91.7 $ 47.7 $ 86.4
State 8.6 5.0 5.0
Foreign 55.4 64.2 50.0
Total current 155.7 116.9 141.4
Deferred:
United States – Federal (12.5) 29.0 (25.3)
State (0.5) 1.1 (0.9)
Foreign 4.8 (3.1) (2.4)
Total deferred (8.2) 27.0 (28.6)
Provision for income taxes $147.5 $143.9 $112.8
The source of pre-tax earnings was:
2009 2008 2007
United States $197.3 $197.9 $183.1
Foreign 248.0 275.3 251.1
Pre-tax earnings $445.3 $473.2 $434.2
Notes to Consolidated Financial Statements
(Dollars in millions, except per share and percentage data)