Energizer 2009 Annual Report Download - page 14
Download and view the complete annual report
Please find page 14 of the 2009 Energizer annual report below. You can navigate through the pages in the report by either clicking on the pages listed below, or by using the keyword search tool below to find specific information within the annual report.-
 1
1 -
2
-
3
-
 4
4 -
 5
5 -
 6
6 -
 7
7 -
 8
8 -
 9
9 -
 10
10 -
 11
11 -
 12
12 -
 13
13 -
 14
14 -
 15
15 -
 16
16 -
 17
17 -
 18
18 -
 19
19 -
 20
20 -
 21
21 -
 22
22 -
 23
23 -
 24
24 -
25
-
26
-
27
-
28
-
29
-
30
-
31
-
32
-
33
-
34
-
35
-
36
-
37
-
38
-
39
-
40
-
41
-
42
-
43
-
44
-
45
-
46
-
47
-
48
-
49
-
50
-
51
-
52
 |
 |

Management’s Discussion and Analysis of Results of Operations and Financial Condition
(Dollars in millions, except per share and percentage data)
PAGE 12 ENERGIZER HOLDINGS INC. 2009 ANNUAL REPORT
- $1.5, or $0.02 per diluted share, related to prior year income tax
accrual adjustments; and
- $2.3, after-tax, or $0.04 per diluted share, related to the write-up
and subsequent sale of inventory purchased in the shave prepa-
ration acquisition.
■ Income:
- $15.2, after-tax, or $0.24 per diluted share, of income due to a
change in the Company’s paid time off policy (PTO) in the second
quarter of fiscal 2009.
Fiscal 2008 results included:
■ an after-tax expense of $16.5, or $0.28 per diluted share, related
to the write-up and subsequent sale of inventory purchased in the
Playtex acquisition,
■ integration and other realignment costs of $13.4, after-tax, or $0.22
per diluted share, and
■ a net, unfavorable prior year income tax accrual adjustment of $1.1,
or $0.02 per diluted share.
Fiscal 2007 results included:
■ favorable adjustments of $21.9, or $0.37 per diluted share, related
to a reduction of deferred tax balances and prior years’ tax accruals
and previously unrecognized tax benefits from prior years’ foreign
losses, and
■ charges of $12.2, after-tax, or $0.21 per diluted share, for the
company’s European restructuring projects.
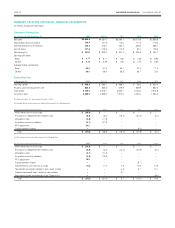
Operating Results
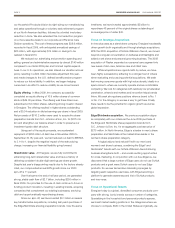
Net Sales Net sales for fiscal 2009 were $3,999.8, down $331.2, or
8%, due primarily to approximately $225 of unfavorable currency. Net
sales in the Household Products division decreased $364.8, or 15%,
or approximately $220, down 9% on a constant currency basis. Net
sales in the Personal Care business increased $33.6, or 2%, or
approximately $113, up 6%, on a constant currency basis.
Gross Profit Gross profit dollars were $1,858.6 in 2009, a decrease
of $179.1, or 9%, due primarily to the unfavorable impact of currency,
which we estimate reduced gross margin by approximately $160 in
fiscal 2009 as compared to the prior year.
Gross margin as a percent of net sales was 46.5% in 2009, 47.0%
in 2008 and 47.7% in 2007. The margin percentage decline in 2009
is due primarily to unfavorable currency, which we estimate reduced
gross margin by approximately 130 basis points. The margin percent-
age decline in 2008 is due primarily to higher year over year product
costs, including the impact of the $27.5 charge related to the step-up
of inventory acquired in the Playtex acquisition.
Selling, General and Administrative Selling, general and administra-
tive expenses (SG&A) were $742.6, a decrease of $51.4 due primarily
to the favorable impact of currency of approximately $44 and reduced
overhead spending. As a percent of net sales, SG&A was 18.6%, up
slightly from 18.3% in the prior year due to the year over year net sales
decline described above. SG&A increased $166.1 in 2008 due
primarily to the acquisition of Playtex.
Advertising and Promotion Advertising and promotion (A&P)
decreased $72.3 in 2009 due to reduced spending, and approximately
$23 of favorable currency. A&P increased $91.6 in 2008 due to the
acquisition of Playtex, which added $112.3 to A&P for 2008.
A&P expense was 10.4%, 11.2% and 11.7% of sales for 2009, 2008
and 2007, respectively. In addition to the impact that accompanies a
major acquisition, A&P expense may vary from year to year with new
product launches, strategic brand support initiatives, the overall
competitive environment, and the state of the global economy.
Research and Development Research and development (R&D)
expense was $90.5 in 2009, $91.7 in 2008 and $70.7 in 2007. The
expense in 2008 includes $19.9 for Playtex, which represents the
majority of the increase. As a percent of sales, R&D expense was 2.3%
in 2009 and 2.1% in 2008 and 2007.
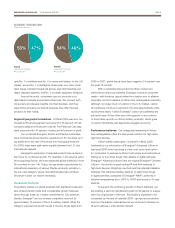
Non-GAAP Financial Measures While the Company reports financial
results in accordance with accounting principles generally accepted
in the U.S. (“GAAP”), this discussion includes non-GAAP measures.
These non-GAAP measures, such as comparisons excluding the
impact of currency and the change in net sales for the Playtex product
lines in 2008 as compared to pro forma 2007, which was prior to our
acquisition of Playtex, are not in accordance with, nor are they a sub-
stitute for, GAAP measures. The Company believes these non-GAAP
measures provide a meaningful comparison to the corresponding
reported period and assist investors in performing analysis consistent
with financial models developed by research analysts. Investors should
consider non-GAAP measures in addition to, not as a substitute for, or
superior to, the comparable GAAP measures.
Segment Results Operations for the Company are managed via two
segments - Household Products (battery and portable lighting prod-
ucts) and Personal Care (wet shave, skin, feminine and infant care).
Segment performance is evaluated based on segment operating profit,
exclusive of general corporate expenses, share-based compensation
costs, costs associated with most restructuring, integration or busi-
ness realignment activities, including the recent VERO, RIF and change
in PTO policy, and amortization of intangible assets. Financial items,
such as interest income and expense, are managed on a global basis
at the corporate level. This structure is the basis for the Company’s
reportable operating segment information presented in Note 18 to the
Consolidated Financial Statements.
The reduction in gross profit associated with the write-up and subse-
quent sale of the inventory acquired in the Edge/Skintimate acquisition
in fiscal 2009, which was $3.7, and the Playtex acquisition in fiscal
2008, which was $27.5, as well as the related acquisition integration
costs in both periods are not reflected in the Personal Care segment,
but rather presented below segment profit, as they are non-recurring
items directly associated with the acquisitions. Such presentation
reflects management’s view on how it evaluates segment performance.