Energizer 2009 Annual Report Download - page 16
Download and view the complete annual report
Please find page 16 of the 2009 Energizer annual report below. You can navigate through the pages in the report by either clicking on the pages listed below, or by using the keyword search tool below to find specific information within the annual report.-
 1
1 -
2
-
3
-
4
-
5
-
 6
6 -
 7
7 -
 8
8 -
 9
9 -
 10
10 -
 11
11 -
 12
12 -
 13
13 -
 14
14 -
 15
15 -
 16
16 -
 17
17 -
 18
18 -
 19
19 -
 20
20 -
 21
21 -
 22
22 -
 23
23 -
 24
24 -
 25
25 -
 26
26 -
27
-
28
-
29
-
30
-
31
-
32
-
33
-
34
-
35
-
36
-
37
-
38
-
39
-
40
-
41
-
42
-
43
-
44
-
45
-
46
-
47
-
48
-
49
-
50
-
51
-
52
 |
 |

Management’s Discussion and Analysis of Results of Operations and Financial Condition
(Dollars in millions, except per share and percentage data)
PAGE 14 ENERGIZER HOLDINGS INC. 2009 ANNUAL REPORT
As noted previously, Energizer’s acquisition of Playtex was completed
on October 1, 2007, the first business day of fiscal 2008. Therefore,
Playtex is not included in the attached 2007 financial statements. To
provide a clearer understanding of the impact of the acquisition on
comparative net sales results between fiscal 2008 and fiscal 2007,
the comparison of the 2008 results for the Playtex product lines pre-
sented in the next paragraph are versus unaudited pro forma results
for the year ended September 30, 2007 for those same product lines.
Hawaiian Tropic results are included in the 2007 pro forma net sales
comparative beginning on April 18, 2007, the date at which Playtex
acquired the business.
On a reported basis, net sales for 2008 were $1,856.7, an increase
of $867.9, or 88%, due primarily to the acquisition of Playtex, which
added $771.7 and the favorable impact of currency of approximately
$67. On a constant currency basis, net sales increased 81% due to
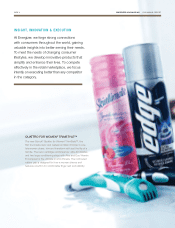
the acquisition of Playtex. Wet shave net sales increased 10% due
primarily to the impact of favorable currency of approximately $67 and
higher volumes in disposable razors and the Quattro family of prod-
ucts. The remaining product discussions regarding sales comparisons
for the Playtex product lines for fiscal 2008 are presented as compared
to the 2007 pro forma results described in the previous paragraph.
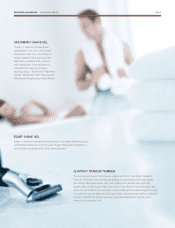
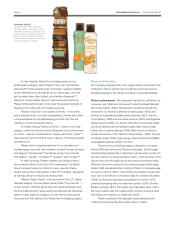
Skin Care net sales increased 22% in 2008 due to the inclusion of
Hawaiian Tropic, which was acquired by Playtex in April 2007.
Excluding the impact of Hawaiian Tropic, Skin Care net sales
increased 5% driven by growth in Banana Boat. Feminine Care
net sales decreased 1% due to the discontinuation of the Beyond
cardboard applicator tampon in 2007 partially offset by growth in
plastic applicator tampons. Sales of plastic applicator tampons
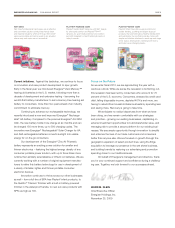
increased 3% in 2008. Infant Care net sales were essentially flat as
higher sales of Diaper Genie and the disposable Drop-In product were
offset by a decline in sales of reusable infant bottles as the company
transitioned to bisphenol A (BPA)-free products.
Segment profit for fiscal 2008 was $322.5, up $167.0, or 107%, due
to the acquisition of Playtex, which added $131 to segment profit, and
the impact of favorable currency of approximately $22.
Looking forward, as with Household Products, we expect to increase
our investment in advertising and promotion both in dollars and as a
percent of net sales in fiscal 2010. In the case of Personal Care, we
expect the investment in advertising and promotion will be at a level
that matches or somewhat exceeds the percent of net sales spent in
fiscal 2008, the first full year of the Playtex acquisition. In fiscal 2009,
our level of spending was reduced in response to the severe economic
downturn and unfavorable currency environment. While we believe this
was prudent in 2009, we believe higher investment levels are preferred
in 2010 to maintain the long term health of our personal care portfolio.
In addition, we expect to invest in certain targeted areas outside of
advertising and promotion, most notably in support of our innovation
objectives and in support of sales growth initiatives in key markets.
Partially funding this increased investment is expected segment profit
favorability in currency and material costs, based on current market
conditions. We expect currency will be favorably impacted by $15 to
$17, net of related currency hedges, in fiscal 2010 as compared to
fiscal 2009. In addition, we expect material costs, based on current
market conditions, to be $4 to $6 favorable as compared to average
material costs in fiscal 2009.
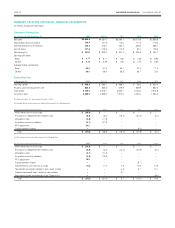
GE NER AL COR POR AT E A ND OTH ER EXP ENS ES
2009 2008 2007
General Corporate Expenses $ 83.8 $ 83.8 $ 93.3
Integration/Other Realignment 13.6 21.1 18.2
Sub-Total 97.4 104.9 111.5
VERO/Separation Costs 38.6 – –
PTO Policy Change (24.1) – –
Acquisition inventory valuation 3.7 27.5 –
General Corporate and Other
Expenses $115.6 $132.4 $111.5
% of total net sales 2.9% 3.1% 3.3%
General Corporate and Other Expenses For the year, general
corporate expenses, including integration/other realignment, decreased
$7.5 due primarily to lower Playtex integration costs, which declined by
$13.8 year over year. In addition, higher costs associated with certain
realignment activities in foreign affiliates were partially offset by lower
corporate compensation expenses.
In the fourth quarter of 2009, the Company implemented the VERO for
eligible U.S. colleagues. The decision to accept the cash benefits offered
under the VERO was at the election of the colleague and was irrevo-
cable. Payments under the VERO were cash only, and did not include
any enhancement to pension or retirement benefits. In addition, the
Company implemented a RIF, primarily in the U.S., to further adjust the
organizational structure. The total charge for the VERO and RIF in the
fourth quarter of 2009 was $38.6 and was included in SG&A. See Note
6 to the Consolidated Financial Statements for further information.
In 2009, we recorded a favorable adjustment of $24.1 resulting from
a change in the policy under which colleagues earn and vest in the
Company’s paid time off (PTO) benefit. Prior to the change, colleagues
were granted and vested in their total PTO days at the beginning of
the calendar year, and received a cash payment for unused days in the
event of termination during the year. As such, the value of a full year of
PTO, net of days used, was accrued at any given balance sheet date.
As part of a recent review of certain benefit programs, this policy was
revised to a more “market” policy for PTO. The revised policy has an
“earn as you go” approach, under which colleagues earn current-year
PTO on a pro-rata basis as they work during the year. As a result of
this change, any previously earned and vested benefit under the prior
policy was forfeited, and the required liability at the date of the policy
change was adjusted to reflect the revised benefit.
For fiscal 2008, general corporate expenses, including integration and
other realignment costs, decreased $6.6, as $17.9 of Playtex integra-
tion costs in 2008 were offset by lower compensation expenses and
lower realignment expenses as compared to fiscal 2007. The Com-
pany estimates that approximately $14 of favorable synergies were
achieved at, or shortly after, the October 2007 Playtex acquisition date
via a reduction of Playtex corporate expenses including executive and
stock related compensation and public company costs. However, the