Energizer 2008 Annual Report Download - page 45
Download and view the complete annual report
Please find page 45 of the 2008 Energizer annual report below. You can navigate through the pages in the report by either clicking on the pages listed below, or by using the keyword search tool below to find specific information within the annual report.-
 1
1 -
2
-
3
-
4
-
5
-
6
-
7
-
8
-
9
-
10
-
11
-
12
-
13
-
14
-
15
-
16
-
17
-
18
-
19
-
20
-
21
-
22
-
23
-
24
-
25
-
26
-
27
-
28
-
29
-
30
-
31
-
32
-
33
-
34
-
 35
35 -
 36
36 -
 37
37 -
 38
38 -
 39
39 -
 40
40 -
 41
41 -
 42
42 -
 43
43 -
 44
44 -
 45
45 -
 46
46 -
 47
47 -
 48
48
 |
 |

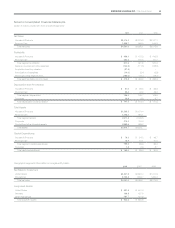
ENERGIZER HOLDINGS, INC. 2008 Annual Report 43
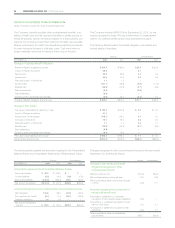
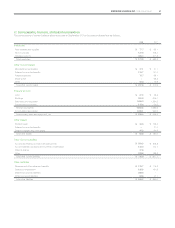
2008 2007 2006
Net Sales
Household Products $2,474.3 $2,376.3 $2,147.1
Personal Care 1,856.7 988.8 929.8
Total net sales $4,331.0 $3,365.1 $3,076.9
Profitability
Household Products $ 489.1 $ 472.3 $ 442.3
Personal Care 322.5 155.5 127.7
Total segment profitability 811.6 627.8 570.0
General corporate and other expenses (104.9) (111.5) (128.9)
Acquisition inventory valuation (27.5) – –
Amortization of intangibles (14.0) (5.4) (5.3)
Interest and other financial items (192.0) (76.7) (79.2)
Total earnings before income taxes $ 473.2 $ 434.2 $ 356.6
Depreciation and Amortization
Household Products $ 67.0 $ 66.5 $ 65.8
Personal Care 59.4 42.2 43.0
Total segment depreciation 126.4 108.7 108.8
Corporate 14.9 6.3 8.7
Total depreciation and amortization $ 141.3 $ 115.0 $ 117.5
Total Assets
Household Products $1,505.5 $1,474.4
Personal Care 1,066.3 664.1
Total segment assets 2,571.8 2,138.5
Corporate 375.3 724.0
Goodwill and other intangible assets 2,869.6 663.2
Total assets $5,816.7 $3,525.7
Capital Expenditures
Household Products $ 79.3 $ 54.2 $ 48.7
Personal Care 78.9 34.1 37.5
Total segment capital expenditures 158.2 88.3 86.2
Corporate 1.8 0.3 8.7
Total capital expenditures $ 160.0 $ 88.6 $ 94.9
Geographic segment information on a legal entity basis:
2008 2007 2006
Net Sales to Customers
United States $2,207.8 $1,561.4 $1,474.5
International 2,123.2 1,803.7 1,602.4
Total net sales $4,331.0 $3,365.1 $3,076.9
Long-Lived Assets
United States $ 591.8 $ 541.4
Germany 136.8 137.9
Other International 191.7 151.6
Total long-lived assets $ 920.3 $ 830.9
Notes to Consolidated Financial Statements
(Dollars in millions, except per share and percentage data)