Energizer 2008 Annual Report Download - page 23
Download and view the complete annual report
Please find page 23 of the 2008 Energizer annual report below. You can navigate through the pages in the report by either clicking on the pages listed below, or by using the keyword search tool below to find specific information within the annual report.-
 1
1 -
2
-
3
-
4
-
5
-
6
-
7
-
8
-
9
-
10
-
11
-
12
-
 13
13 -
 14
14 -
 15
15 -
 16
16 -
 17
17 -
 18
18 -
 19
19 -
 20
20 -
 21
21 -
 22
22 -
 23
23 -
 24
24 -
 25
25 -
 26
26 -
 27
27 -
 28
28 -
 29
29 -
 30
30 -
 31
31 -
 32
32 -
 33
33 -
34
-
35
-
36
-
37
-
38
-
39
-
40
-
41
-
42
-
43
-
44
-
45
-
46
-
47
-
48
 |
 |

ENERGIZER HOLDINGS, INC. 2008 Annual Report 21
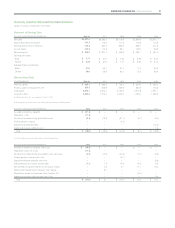
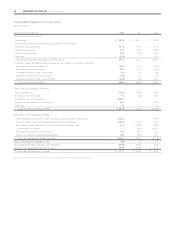
Statement of Earnings Data
FOR THE YEARS ENDED SEPTEMBER 30, 2008 (a) 2007 2006 2005 2004
Net sales $4,331.0 $3,365.1 $3,076.9 $2,989.8 $2,812.7
Depreciation and amortization 141.3 115.0 117.5 116.3 115.8
Earnings before income taxes (b) 473.2 434.2 356.6 388.7 347.8
Income taxes 143.9 112.8 95.7 108.0 86.8
Net earnings (c) $ 329.3 $ 321.4 $ 260.9 $ 280.7 $ 261.0
Earnings per share:
Basic $ 5.71 $ 5.67 $ 4.26 $ 3.95 $ 3.24
Diluted $ 5.59 $ 5.51 $ 4.14 $ 3.82 $ 3.13
Average shares outstanding:
Basic 57.6 56.7 61.2 71.0 80.6
Diluted 58.9 58.3 63.1 73.5 83.4
Balance Sheet Data
AT SEPTEMBER 30, 2008 (a) 2007 2006 2005 2004
Working capital $ 665.1 $ 888.5 $ 708.2 $ 626.4 $ 469.2
Property, plant and equipment, net 835.5 649.9 659.9 682.5 705.6
Total assets 5,816.7 3,525.7 3,132.6 2,973.8 2,931.7
Long-term debt 2,589.5 1,372.0 1,625.0 1,295.0 1,059.6
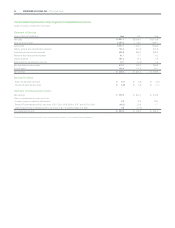
(a) Playtex Products, Inc. was acquired October 1, 2007
(b) Earnings before income taxes were (reduced)/increased by the following items:
FOR THE YEARS ENDED SEPTEMBER 30, 2008 2007 2006 2005 2004
Acquisition inventory valuation $ (27.5) $ – $ – $ – $ –
Integration costs (17.9) – – – –
Provisions for restructuring and related costs (3.2) (18.2) (37.4) (5.7) (5.2)
Foreign pension charge – – (4.5) – –
Special termination benefits – – – – (15.2)
Intellectual property rights income –
– – – 1.5
Total $ (48.6) $ (18.2) $ (41.9) $ (5.7) $ (18.9)
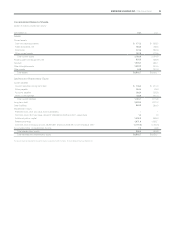
(c) Net earnings were (reduced)/increased by the following items:
FOR THE YEARS ENDED SEPTEMBER 30, 2008 2007 2006 2005 2004
Acquisition inventory valuation, net of tax $ (16.5) $ – $ – $ – $ –
Integration costs, net of tax (11.4) – – – –
Provisions for restructuring and related costs, net of tax (2.0) (12.2) (24.9) (3.7) (3.8)
Foreign pension charge, net of tax – – (3.7) – –
Special termination benefits, net of tax – – – – (9.6)
Adjustments to prior years’ tax accruals (1.1) 7.9 10.9 10.6 8.5
Tax benefits recognized related to prior years’ losses – 4.3 5.7 14.7 16.2
Deferred tax benefit due to statutory rate change – 9.7 – – –
Repatriation under the American Jobs Creation Act – – – (9.0) –
Intellectual property rights income, net of tax – – – – 0.9
Total $ (31.0) $ 9.7 $ (12.0) $ 12.6 $ 12.2
Summary Selected Historical Financial Information
(Dollars in millions, except per share data)