Energizer 2008 Annual Report Download - page 38
Download and view the complete annual report
Please find page 38 of the 2008 Energizer annual report below. You can navigate through the pages in the report by either clicking on the pages listed below, or by using the keyword search tool below to find specific information within the annual report.-
 1
1 -
2
-
3
-
4
-
5
-
6
-
7
-
8
-
9
-
10
-
11
-
12
-
13
-
14
-
15
-
16
-
17
-
18
-
19
-
20
-
21
-
22
-
23
-
24
-
25
-
26
-
27
-
 28
28 -
 29
29 -
 30
30 -
 31
31 -
 32
32 -
 33
33 -
 34
34 -
 35
35 -
 36
36 -
 37
37 -
 38
38 -
 39
39 -
 40
40 -
 41
41 -
 42
42 -
 43
43 -
 44
44 -
 45
45 -
 46
46 -
 47
47 -
 48
48
 |
 |

36 ENERGIZER HOLDINGS, INC. 2008 Annual Report
Notes to Consolidated Financial Statements
(Dollars in millions, except per share and percentage data)
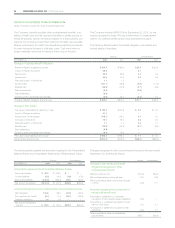
The Company currently provides other postretirement benefits, con-
sisting of health care and life insurance benefits for certain groups of
retired employees. Certain retirees are eligible for a fixed subsidy, pro-
vided by the Company, toward their total cost of health care benefits.
Retiree contributions for health care benefits are adjusted periodically
to cover the entire increase in total plan costs. Cost trend rates no
longer materially impact the Company’s future cost of the plan.
The Company adopted SFAS 158 on September 30, 2007, on the
required prospective basis. We use a September 30 measurement
date for our defined benefit pension and postretirement plans.
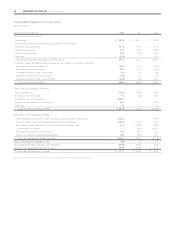
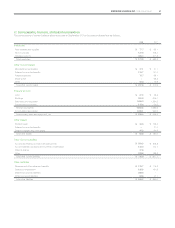
The following tables present the benefit obligation, plan assets and
funded status of the plans:
Pension Postretirement
SEPTEMBER 30, 2008 2007 2008 2007
Change in Projected Benefit Obligation
Benefit obligation at beginning of year $ 815.4 $790.9 $ 35.5 $ 51.6
Impact of Playtex acquisition 69.6 – 8.1 –
Service cost 33.9 29.9 0.4 0.4
Interest cost 50.6 41.3 2.5 2.9
Plan participants' contributions 1.1 1.2 - –
Actuarial gain (107.7) (28.8) (2.9) (17.6)
Benefits paid (48.5) (42.3) (2.7) (2.5)
Plan amendments (2.6) – (2.9) –
Plan settlements (6.8) – – –
Foreign currency exchange rate changes (5.0) 23.2 (0.3) 0.7
Projected Benefit Obligation at end of year $ 800.0 $815.4 $ 37.7 $ 35.5
Change in Plan Assets
Fair value of plan assets at beginning of year $ 795.2 $704.8 $ 2.0 $ 2.4
Impact of Playtex acquisition 61.4 – – –
Actual return on plan assets (118.7) 100.0 0.1 0.1
Company contributions 18.7 18.2 2.3 2.0
Plan participants' contributions 1.1 1.2 4.0 4.1
Benefits paid (48.5) (42.3) (6.7) (6.6)
Plan settlements (6.8) – – –
Foreign currency exchange rate changes (6.4) 13.3 – –
Fair value of plan assets at end of year $ 696.0 $795.2 $ 1.7 $ 2.0
Funded status at end of year $(104.0) $ (20.2) $(36.0) $(33.5)
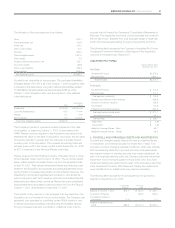
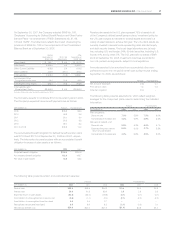
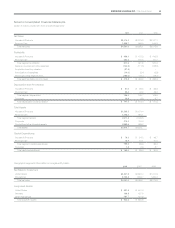
The following table presents the amounts recognized in the Consolidated
Balance Sheets and Consolidated Statements of Shareholders’ Equity.
Pension Postretirement
SEPTEMBER 30, 2008 2007 2008 2007
Amounts Recognized in the Consolidated Balance Sheets
Noncurrent assets $ 42.5 $ 125.2 $ – $ –
Current liabilities (6.5) (6.2) (1.9) (0.9)
Noncurrent liabilities (140.0) (139.2) (34.1) (32.6)
Net amount recognized $(104.0) $ (20.2) $(36.0) $(33.5)
Amounts Recognized in Accumulated Other Comprehensive Income
Net loss/(gain) 106.6 38.2 (27.0) (26.4)
Prior service cost (credit) (9.7) (7.4) (26.7) (25.9)
Transition obligation 1.4 1.8 – –
Net amount recognized,
pre-tax
$ 98.3
$ 32.6
$(53.7) $(52.3)
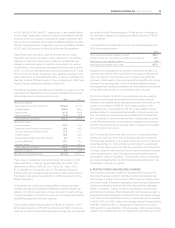
Changes recognized in other comprehensive income for the year ended
September 30, 2008 are as follows:
Pension Postretirement
Changes in plan assets and benefit
obligations recognized in other
comprehensive income
New prior service cost $ (2.6) $(2.9)
Net loss/(gain) arising during the year 74.3 (2.8)
Effect of exchange rates on amounts included
in AOCI (2.3)
0.1
Amounts recognized as a component of
net periodic benefit cost
Amortization, settlement or curtailment
recognition of net transition asset (obligation) (0.5)
–
Amortization or curtailment recognition of prior
service credit (cost) 0.6 2.1
Amortization or settlement recognition of net
gain/(loss) (3.8) 2.1
Total recognized in other comprehensive
loss/(income) $65.7 $(1.4)