Energizer 2008 Annual Report Download - page 16
Download and view the complete annual report
Please find page 16 of the 2008 Energizer annual report below. You can navigate through the pages in the report by either clicking on the pages listed below, or by using the keyword search tool below to find specific information within the annual report.-
 1
1 -
2
-
3
-
4
-
5
-
 6
6 -
 7
7 -
 8
8 -
 9
9 -
 10
10 -
 11
11 -
 12
12 -
 13
13 -
 14
14 -
 15
15 -
 16
16 -
 17
17 -
 18
18 -
 19
19 -
 20
20 -
 21
21 -
 22
22 -
 23
23 -
 24
24 -
 25
25 -
 26
26 -
27
-
28
-
29
-
30
-
31
-
32
-
33
-
34
-
35
-
36
-
37
-
38
-
39
-
40
-
41
-
42
-
43
-
44
-
45
-
46
-
47
-
48
 |
 |

14 ENERGIZER HOLDINGS, INC. 2008 Annual Report
Management’s Discussion and Analysis of Results of Operations and Financial Condition
(Dollars in millions, except per share and percentage data)
Looking forward, similar to Household Products, commodities, raw
materials and other inflationary input costs for Personal Care are
estimated to be unfavorable $35 to $40 in 2009 compared to 2008
average costs based on current market conditions. Pricing actions
already initiated together with manufacturing cost reduction programs
and incremental synergies of approximately $32 from the Playtex
acquisition should more than offset these increases.
Finally, as noted previously, the U.S. dollar has recently strengthened
against most other currencies, which will negatively impact reported
sales and profits in Personal Care. At November 17, 2008 foreign
currency exchange rates, we estimate the impact on segment profit
due to currency translation to be approximately $25 to $30 unfavorable
for Personal Care as compared to the 2008 average currency
translation rate.
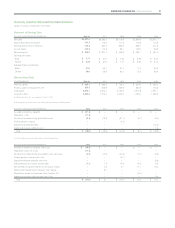
General Corporate and Other Expenses
2008 2007 2006
General Corporate Expenses $ 83.8 $ 93.3 $ 87.0
Integration 17.9 – –
General Corporate Expenses
with Integration 101.7 93.3 87.0
Restructuring and Related
Charges 3.2 18.2 37.4
Foreign Pension Charge –– 4.5
General Corporate and Other
Expenses $104.9 $111.5 $128.9
% of total net sales 2.4% 3.3% 4.2%
General Corporate and Other Expenses For the year, general
corporate expenses, including integration costs increased $8.4,
as $17.9 of Playtex integration costs were partially offset by lower
compensation expenses. The Company estimates that approximately
$14 of favorable synergies were achieved at, or shortly after, the
acquisition date via a reduction of Playtex corporate expenses includ-
ing executive and stock related compensation and public company
costs. However, the savings had no impact on the year over year
comparative as the costs were not included in the Company’s current
year or historical results. The Playtex integration efforts will continue
into 2009, but integration costs are expected to be much lower than
in 2008. Fiscal 2008, 2007 and 2006 included $3.2, $18.2 and $37.4,
respectively, of restructuring and realignment costs associated with a
project to improve the effectiveness and reduce costs of the Compa-
ny’s European packaging, warehousing and distribution activities.
General corporate expenses increased in 2007 compared to 2006 due
to higher stock-based compensation, partially offset by lower project
related costs.
See Note 6 to the Consolidated Financial Statements for further infor-
mation on restructuring activities.
Interest and Other Financing Items Interest expense for the fiscal
year increased $90.1 on higher average borrowings resulting from
the Playtex acquisition. Other financing items, which includes interest
income and foreign exchange gains and losses from the Company’s
worldwide affiliates, were unfavorable $25.2 for the fiscal year due
primarily to exchange losses in the current period compared to
exchange gains last year and lower interest income of $8.4. These
exchange losses were offset by currency gains in segment profit.
Interest expense increased $13.3 in 2007 as compared to 2006 due
to higher average borrowings resulting from share repurchases and
higher interest rates. Other financing expense was favorable $15.8 in
2007 compared to 2006, due to higher interest income of $11.0 and
currency exchange gains in 2007 compared to currency exchange
losses in 2006.
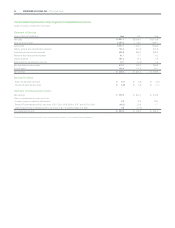
Income Taxes Income taxes, which include federal, state and foreign
taxes, were 30.4%, 26.0% and 26.8% of earnings before income taxes
in 2008, 2007 and 2006, respectively. Income taxes include the follow-
ing items which impact the overall tax rate:
■ Adjustments were recorded in each of the three years to revise
previously recorded tax accruals to reflect refinement of estimates
of tax attributes to amounts in filed returns, settlement of tax audits
and certain other tax adjustments in a number of jurisdictions. Such
adjustments increased the income tax provision by $1.1 in 2008
and decreased the income tax provision by $7.9 and $10.9 in 2007
and 2006, respectively.
■ A tax benefit of $11.0 was recorded in 2008 associated with the
write-up and subsequent sale of inventory acquired in the Playtex
acquisition.
■ In 2007 and 2006, $4.3 and $5.7, respectively, of tax benefits
related to prior years’ losses were recorded. These benefits related
to foreign countries where our subsidiary subsequently began to
generate earnings and could reasonably expect future profitability
sufficient to utilize tax loss carry-forwards prior to expiration.
Improved profitability in Mexico in 2007 and 2006 account for
the bulk of the benefits recognized.
■ Legislation enacted in Germany in August 2007 reduced the tax rate
applicable to the Company’s subsidiaries in Germany for fiscal 2008
and beyond. Thus, an adjustment of $9.7 was made to reduce
deferred tax liabilities in fiscal 2007.
Excluding the items discussed above, the income tax percentage was
30.9% in 2008, 31.0% in 2007 and 31.5% in 2006.
The Company’s effective tax rate is highly sensitive to country mix, from
which earnings or losses are derived. Declines in earnings in lower tax
rate countries, earnings increases in higher tax rate countries, increas-
es in repatriation of foreign earnings or operating losses in the future
could increase future tax rates. Additionally, adjustments to prior year
tax accrual estimates could increase or decrease future tax provisions.
LIQUIDITY AND CAPITAL RESOURCES
Operating Activities Cash flow from operations is the primary funding
source for operating needs and capital investments. Cash flow from
operations was $466.5 in 2008, an increase of $21.2 from 2007. Cash
flow from operations was $445.3 in 2007, an increase of $72.3 from
2006. Each of these year over year changes was due to improved
operating cash flow before changes in working capital.