Energizer 2008 Annual Report Download - page 34
Download and view the complete annual report
Please find page 34 of the 2008 Energizer annual report below. You can navigate through the pages in the report by either clicking on the pages listed below, or by using the keyword search tool below to find specific information within the annual report.-
 1
1 -
2
-
3
-
4
-
5
-
6
-
7
-
8
-
9
-
10
-
11
-
12
-
13
-
14
-
15
-
16
-
17
-
18
-
19
-
20
-
21
-
22
-
23
-
 24
24 -
 25
25 -
 26
26 -
 27
27 -
 28
28 -
 29
29 -
 30
30 -
 31
31 -
 32
32 -
 33
33 -
 34
34 -
 35
35 -
 36
36 -
 37
37 -
 38
38 -
 39
39 -
 40
40 -
 41
41 -
 42
42 -
 43
43 -
 44
44 -
45
-
46
-
47
-
48
 |
 |

32 ENERGIZER HOLDINGS, INC. 2008 Annual Report
Notes to Consolidated Financial Statements
(Dollars in millions, except per share and percentage data)
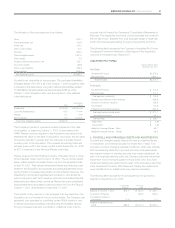
The Company had indefinite-lived trademarks and tradenames of
$1,591.0 at September 30, 2008 and $277.9 at September 30, 2007.
Changes in indefinite-lived trademarks and tradenames are due primarily
to the valuation of assets acquired in the Playtex acquisition and changes
in foreign currency exchange rates.
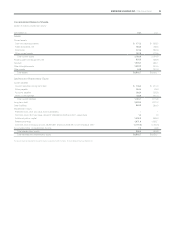
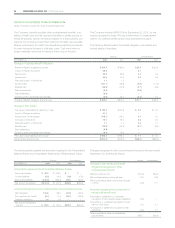
Total amortizable intangible assets at September 30, 2008 are as follows:
Gross
Carrying
Amount
Accumulated
Amortization
Net
Tradenames $ 11.7 $ (6.7) $ 5.0
Technology and patents 41.7 (19.7) 22.0
Customer-related 54.7 (11.1) 43.6
Non-compete agreements 5.0 (3.4) 1.6
Total amortizable intangible
assets $113.1 $(40.9) $72.2
The increase in the gross amortizable intangible assets during fiscal
2008 is primarily due to the valuation of assets acquired in the Playtex
acquisition. Amortizable intangible assets, with a weighted average
remaining life of approximately seven years, are amortized on a straight
line basis over expected lives of 18 months to 15 years.
Amortization expense for intangible assets totaled $14.6 for the current
year. Estimated amortization expense for amortized intangible assets
for the year ended September 30, 2009 is approximately $12.4, $10.4
for the years ended September 30, 2010 through 2012, and $7.9 for
the year ended September 30, 2013.
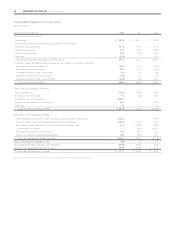
A reconciliation of income taxes with the amounts computed at the statutory federal rate follows:
2008 2007 2006
Computed tax at federal statutory rate $165.6 35.0% $152.0 35.0% $124.8 35.0%
State income taxes, net of federal tax benefit 2.6 0.6 2.7 0.6 1.9 0.5
Foreign tax less than the federal rate (33.1) (7.0) (22.7) (5.2) (17.7) (5.0)
Foreign benefits recognized related to
prior years’ losses
–
– (4.3) (1.0) (5.7) (1.6)
Adjustments to prior years’ tax accruals 1.1 0.2 (7.9) (1.8) (10.9) (3.1)
Deferred tax benefit due to statutory rate change – – (9.7) (2.2) – –
Other taxes on repatriation of foreign earnings 1.5 0.3 11.3 2.6 4.5 1.3
Nontaxable share option 5.7 1.2 (8.1) (1.9) (3.8) (1.0)
Other, net 0.5 0.1 (0.5) (0.1) 2.6 0.7
Total $143.9 30.4% $112.8 26.0% $95.7 26.8%
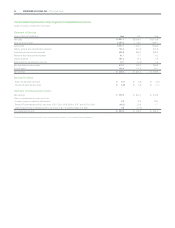
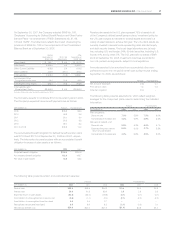
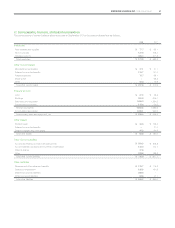
5. INCOME TAXES
The provisions for income taxes consisted of the following for the years ended September 30:
2008 2007 2006
Currently payable:
United States - Federal $ 47.7 $ 86.4 $63.7
State 5.0 5.0 3.6
Foreign 64.2 50.0 51.7
Total current 116.9 141.4 119.0
Deferred:
United States - Federal 29.0 (25.3) (15.8)
State 1.1 (0.9) (0.6)
Foreign (3.1) (2.4) (6.9)
Total deferred 27.0 (28.6) (23.3)
Provision for income taxes $143.9 $112.8 $95.7
The source of pre-tax earnings was:
2008 2007 2006
United States $197.9 $183.1 $160.2
Foreign 275.3 251.1 196.4
Pre-tax earnings $473.2 $434.2 $356.6